

Credo Technology (NASDAQ: CRDO) — Q1 FY2027 Post Earnings

Post earnings note company quarterly analysis

Operations

Q1 2027
Q1 Revenue ↑ 114.7% YoY $479M
Segments
Credo Technology 100.0%

Key Earnings Driver

Active Electrical Cables Credo Technology’s Q1 revenue increased 114.7% year over year to $479.0M. The ramp-up of AEC solutions at hyperscale data center customers contributed over 90% of the revenue increase.

Key Operating Metrics¹

METRIC

STATUS

Credo Technology↑ 114.7%

Active Electrical Cables

🟢 Scaling

Key Financial Metrics

Gross Margin 64.50% -2.9 pp YoY
Backlog / Revenue 876.0% 8.76x Qtr Rev
CapEx Intensity 1.52% 0.01x Revenue

Key Operating Metrics¹: Core operating metrics relevant to revenue, sourced from website and/or SEC filings for Q, with status based on reported data.
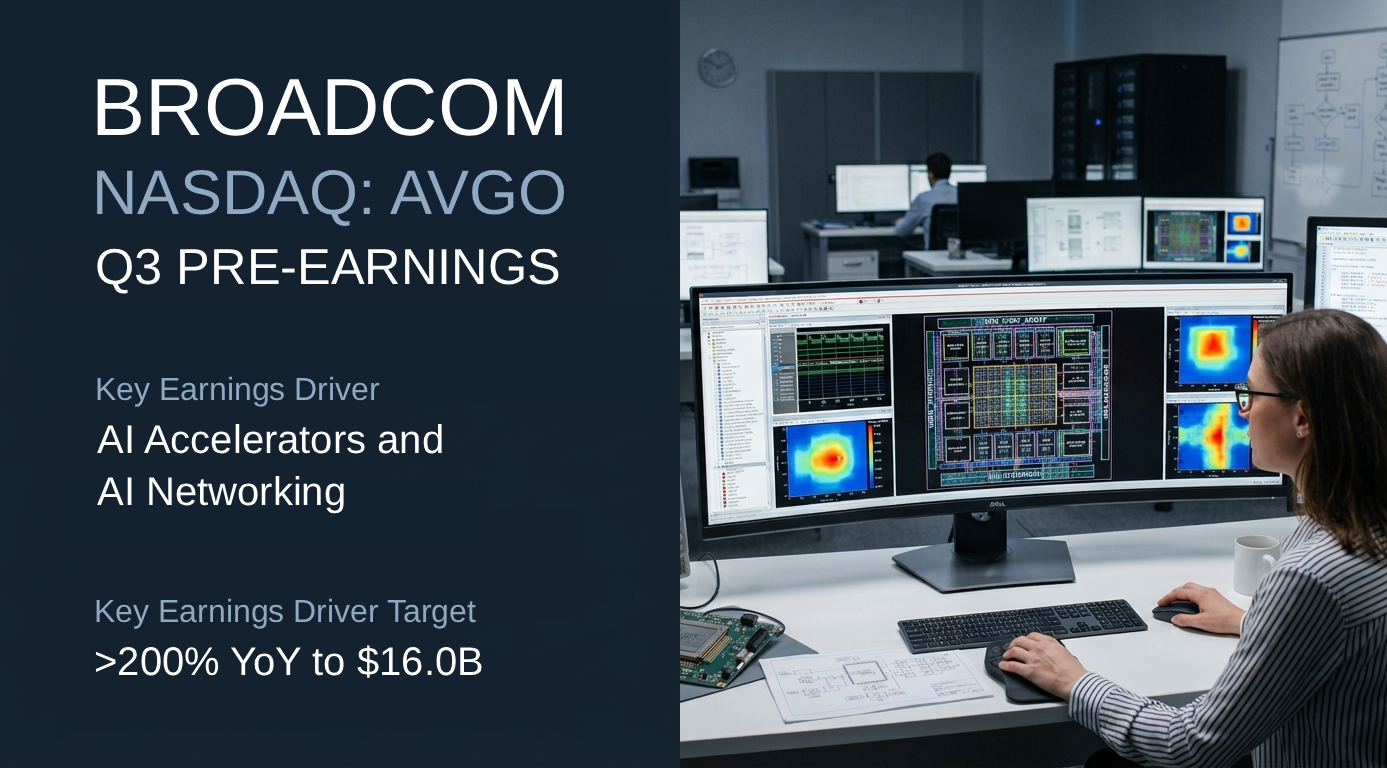
Broadcom (NASDAQ: AVGO) — Q3 FY2026 Pre Earnings

Broadcom avgo q3 26 pre earnings finance note

Operations

Q2 2026
Q2 Revenue ↑ 47.9% YoY $22.19B
Segments
Semiconductor Solutions 67.6%
Infrastructure Software 32.4%

Key Earnings Driver

AI Accelerators and AI Networking Semiconductor Solutions revenue increased 78.5% year over year to $15.0B. Within Semiconductor Solutions, AI semiconductor revenue increased 143.0% to $10.8B, driven by increasing demand for custom AI Accelerators and AI Networking. Infrastructure Software revenue increased 8.8% to $7.2B, primarily driven by VMware Cloud Foundation. For Q3, Hock Tan, President and CEO of Broadcom, expects semiconductor revenue from AI to grow more than 200% year over year to $16.0B.

Key Operating Metrics¹

METRIC

STATUS

Semiconductor Solutions↑ 78.5%

AI semiconductor↑ 143.0%

AI Accelerators

🟢 Scaling

AI Networking

🟢 Scaling

Infrastructure Software↑ 8.8%

VMware Cloud Foundation

Key Financial Metrics

Gross Margin 69.47% +1.51 pp YoY
Backlog / Revenue N/A
CapEx Intensity 1.04% 0.01x Revenue

Key Operating Metrics¹: Core operating metrics relevant to revenue, sourced from website and/or SEC filings for Q, with status based on reported data.

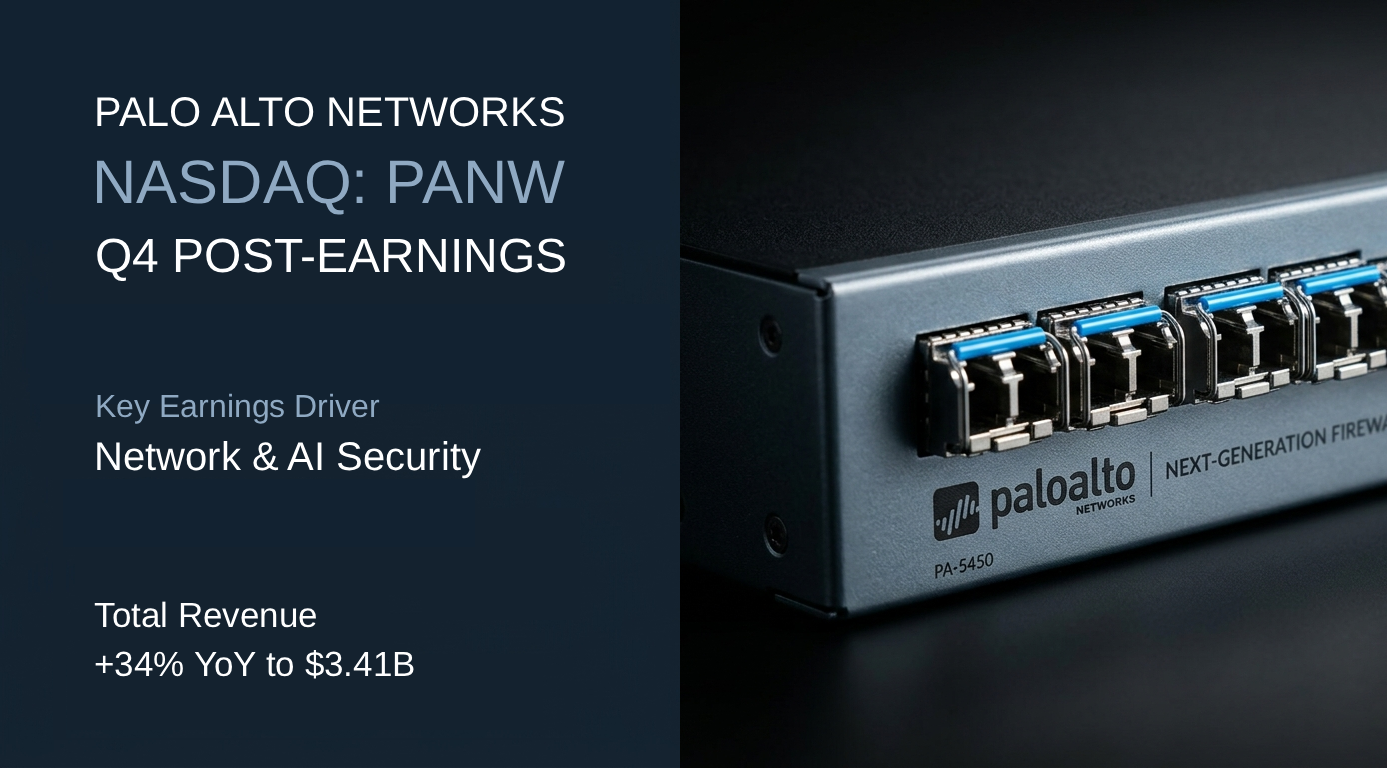
Palo Alto Networks (NASDAQ: PANW) — Q4 FY2026 Post Earnings

Palo Alto Networks panw q4 26 Post Earnings

Operations

Q4 2026
Q4 Revenue ↑ 34.5% YoY $3.41B
Segments
Network & AI Security 68.4%
Cortex 17.2%
Idira 9.8%
Other 4.6%

Key Earnings Driver

Cortex Network & AI Security revenue increased 17% year over year to $2.3B. Cortex revenue increased 25% to $586M. Idira revenue increased 21% pro forma to $336M. Other revenue increased 5% to $157M. Network & AI Security represented 68% of revenue and was the largest reported platform. Management attributed the quarter’s strength to Network & AI Security, Cortex, and Idira.

Key Operating Metrics¹

METRIC

STATUS

Network & AI Security↑ 17.0%

Cortex↑ 25.0%

🟢 Scaling

Key Financial Metrics

Gross Margin 74.80% -1 pp YoY
Backlog / Revenue 621.7% 6.21x Qtr Rev
CapEx Intensity 3.02% 0.03x Revenue

Key Operating Metrics¹: Core operating metrics relevant to revenue, sourced from website and/or SEC filings for Q, with status based on reported data.
MongoDB (NASDAQ: MDB) — Q2 FY2027 Post Earnings

MongoDB q2 27 Post Earnings

Operations

Q2 2027
Q2 Revenue ↑ 30.5% YoY $771.8M
Segments
Subscription 96.8%
Services 3.2%

Key Earnings Driver

MongoDB Enterprise Advanced and other Subscription revenue increased 30.5% year over year to $747.1 million. Within subscription, Atlas-related revenue increased approximately 28.9% to $565.9M and MongoDB Enterprise Advanced and other revenue increased 35.9% to $181.2M. Services revenue increased 29.3% to $24.6M. Management attributed Subscription growth primarily to increased Atlas consumption among large existing customers, alongside growth in Enterprise Advanced.

Key Operating Metrics¹

METRIC

STATUS

Subscription↑ 30.5%

Atlas–related↑ 28.9%

MongoDB Enterprise Advanced and other↑ 35.9%

🟢 Scaling

Key Financial Metrics

Gross Margin 73.82% +2.82 pp YoY
Backlog / Revenue N/A
CapEx Intensity 0.32% 0.00x Revenue

Key Operating Metrics¹: Core operating metrics relevant to revenue, sourced from website and/or SEC filings for Q, with status based on reported data.
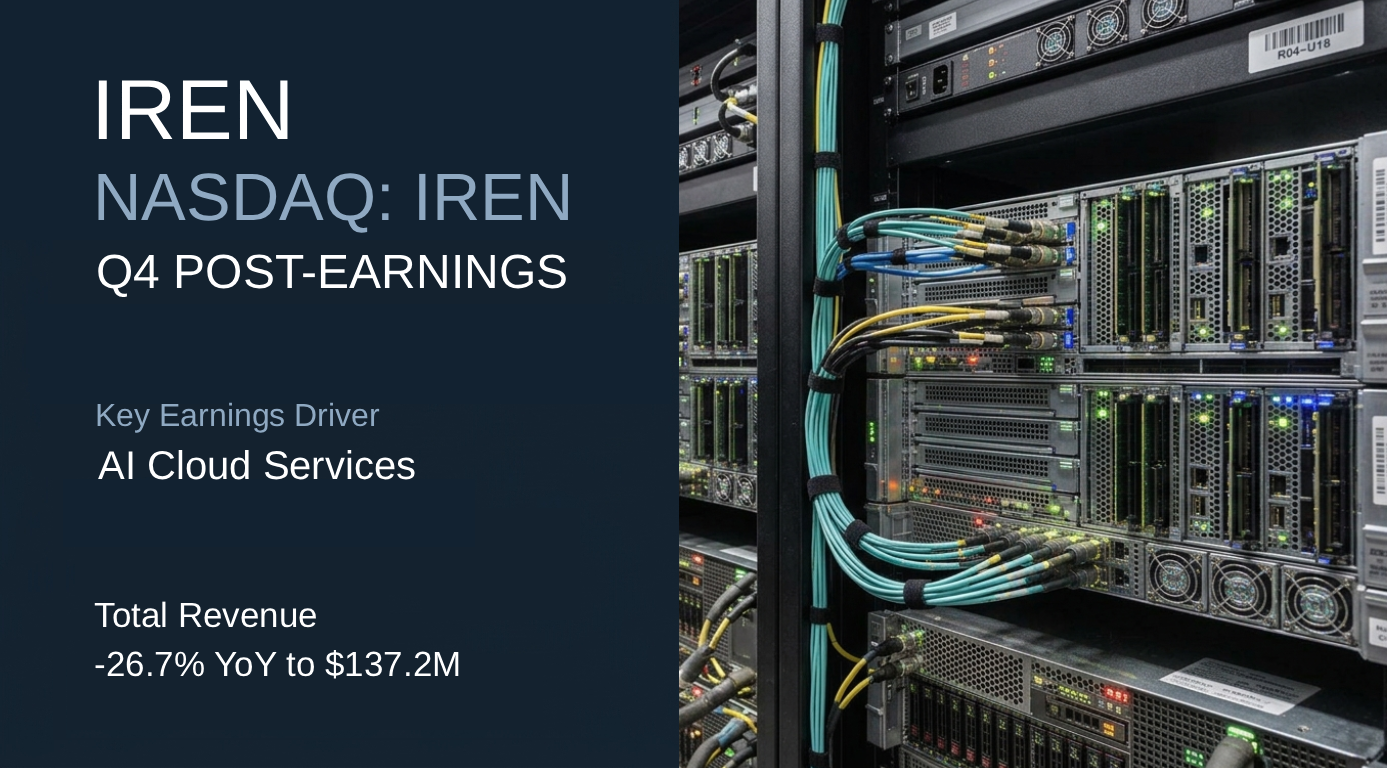
Science Applications International (NASDAQ: SAIC) — Q2 FY2027 Post Earnings

Science Applications International SAIC q2 post earnings

Operations

Q2 2027
Q2 Revenue ↑ 6.3% YoY $1.88B
Segments
Defense and Intelligence 77.1%
Civilian 22.9%

Key Earnings Driver

Commercial, state and local governments and international Defense and Intelligence revenue increased 5.5% year over year to $1.45B. Civilian revenue increased 9.1% to $431M. Within Civilian, Commercial, state and local governments and international increased 30.3%.

Key Operating Metrics¹

METRIC

STATUS

Defense and Intelligence↑ 5.5%

Department of War↑ 7.2%

Intelligence and other federal government agencies↑ 2.0%

Commercial, state and local governments and international→ 0.0%

🟡 Watch

Civilian↑ 9.1%

Department of War↓ 50.0%

🟡 Watch

Intelligence and other federal government agencies↑ 7.5%

Commercial, state and local governments and international↑ 30.3%

🟢 Scaling

Key Operating Metrics¹: Core operating metrics relevant to revenue, sourced from website and/or SEC filings for Q, with status based on reported data.
IREN (NASDAQ: IREN) — Q4 FY2026 Post Earnings

IREN Q4 FT2026 Post Earnings

Operations

Q4 2026
Q4 Revenue ↓ 26.7% YoY $137.2M
Segments
Bitcoin Mining 48.6%
AI Cloud Services 51.4%

Key Earnings Driver

AI Cloud Services Bitcoin Mining revenue declined 63.0% year over year to $66.7M from $180.3M while AI Cloud Services revenue increased 912.7% to $70.5M from $7.0M. Q4 results reflected the transition from Bitcoin Mining to AI Cloud Services. IREN is targeting $4B of AI Cloud Services ARR to be operational by December 31, 2026.

Key Operating Metrics¹

METRIC

STATUS

Bitcoin Mining↓ 63.0%

🟠 Weakening

AI Cloud Services↑ 912.7%

🟢 Scaling

Key Financial Metrics

Gross Margin 75.73% +3.96 pp YoY
Backlog / Revenue N/A
CapEx Intensity 1,441.80% 14.41x Revenue

Key Operating Metrics¹: Core operating metrics relevant to revenue, sourced from website and/or SEC filings for Q, with status based on reported data.

Credo Technology (NASDAQ: CRDO) — Q1 FY2027 Pre Earnings

Credo Technology CRDO Q1 27 Pre Earnings

Operations

Q4 2026
Q4 Revenue ↑ 157.0% YoY $437M
Segments
Credo Technology 100.0%

Key Earnings Driver

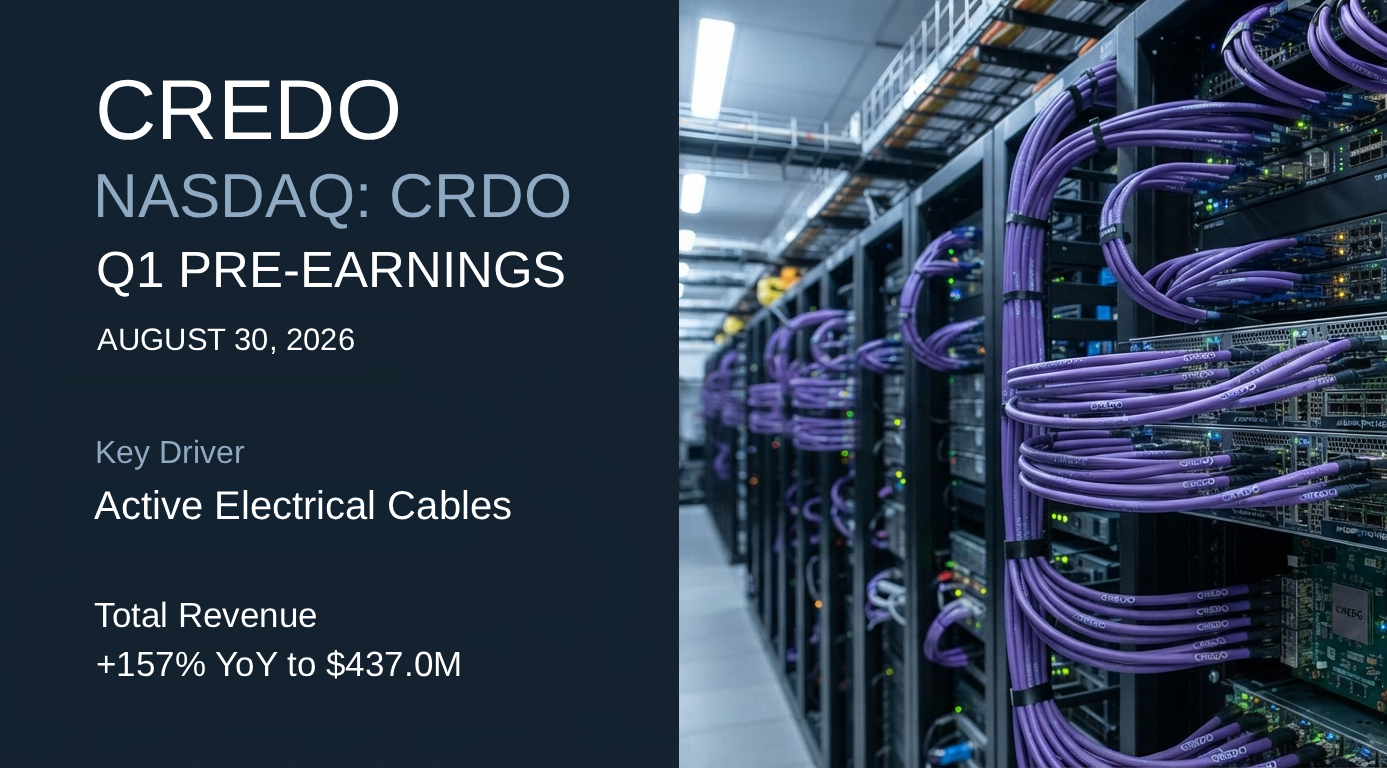
Active Electrical Cables Credo Technology’s Q4 revenue increased 157% year over year to $437.0M. FY2026 revenue increased 206% to $1.34B, with the ramp-up of Active Electrical Cable (AEC) solutions at hyperscale data center customers contributing over 99% of the revenue increase.

Key Operating Metrics¹

METRIC

STATUS

Credo Technology↑ 157.0%

Active Electrical Cables

🟢 Scaling

Key Financial Metrics

Gross Margin 68.20% +1 pp YoY
Backlog / Revenue N/A
CapEx Intensity 1.09% 0.01x Revenue

Key Operating Metrics¹: Core operating metrics relevant to revenue, sourced from website and/or SEC filings for Q, with status based on reported data.

Nebius Group (NASDAQ: NBIS) — Company Catalyst

NBIS Nebius Company Catalyst

Company Catalyst

AI Infrastructure Efficiency Nebius’s full stack infrastructure design targets AI compute efficiency to address power constraints as GPU workloads scale. The company’s infrastructure operates at a portfolio PUE of 1.25 versus a 1.54 global industry average, indicating approximately 19% lower total facility energy consumption for the same IT load and providing a measurable efficiency advantage as GPU infrastructure scales.

Rubrik (NYSE: RBRK) — Q2 FY2027 Post Earnings

Rubrik Q2 27 Post Earnings RBRK

Operations

Q2 2027
Q2 Revenue ↑ 37.9% YoY $427.3M
Segments
Subscription 95.3%
Other 4.7%

Key Earnings Driver

Identity Resilience Subscription revenue increased 37.1% year over year to $407.2 million. Within subscription, Management described Identity Resilience, a Rubrik Security Cloud capability, as one of the company’s fastest-growing product lines. Management reported Cloud ARR growth of 39% to $1.48 billion, with RSC included within the company’s Cloud ARR measure.

Key Operating Metrics¹

METRIC

STATUS

Subscription↑ 37.1%

Rubrik Security Cloud

Identity Resilience

🟢 Scaling

Key Financial Metrics

Gross Margin 78.40% -1.1 pp YoY
Backlog / Revenue N/A
CapEx Intensity 2.62% 0.02x Revenue

Key Operating Metrics¹: Core operating metrics relevant to revenue, sourced from website and/or SEC filings for Q, with status based on reported data.

Elastic (NYSE: ESTC) — Q1 FY2027 Post Earnings

Post earnings note company quarterly analysis

Operations

Q1 2027
Q1 Revenue ↑ 15.1% YoY $478.1M
Segments
Elastic Cloud 49.2%
Other Subscription 44.7%
Services 6.1%

Key Earnings Driver

Elastic Cloud Elastic Cloud revenue increased 20.1% year over year to $235.2 million, Other Subscription Revenue increased 10.7% and Services revenue increased 10%. Elastic Cloud was the company’s fastest-growing reported revenue category.

Key Operating Metrics¹

METRIC

STATUS

Elastic Cloud↑ 20.1%

🟢 Scaling

Other Subscription↑ 10.7%

Key Financial Metrics

Gross Margin 74.50% -2.2 pp YoY
Backlog / Revenue 387.8% 3.87x Qtr Rev
CapEx Intensity 0.12% 0.00x Revenue

Key Operating Metrics¹: Core operating metrics relevant to revenue, sourced from website and/or SEC filings for Q, with status based on reported data.