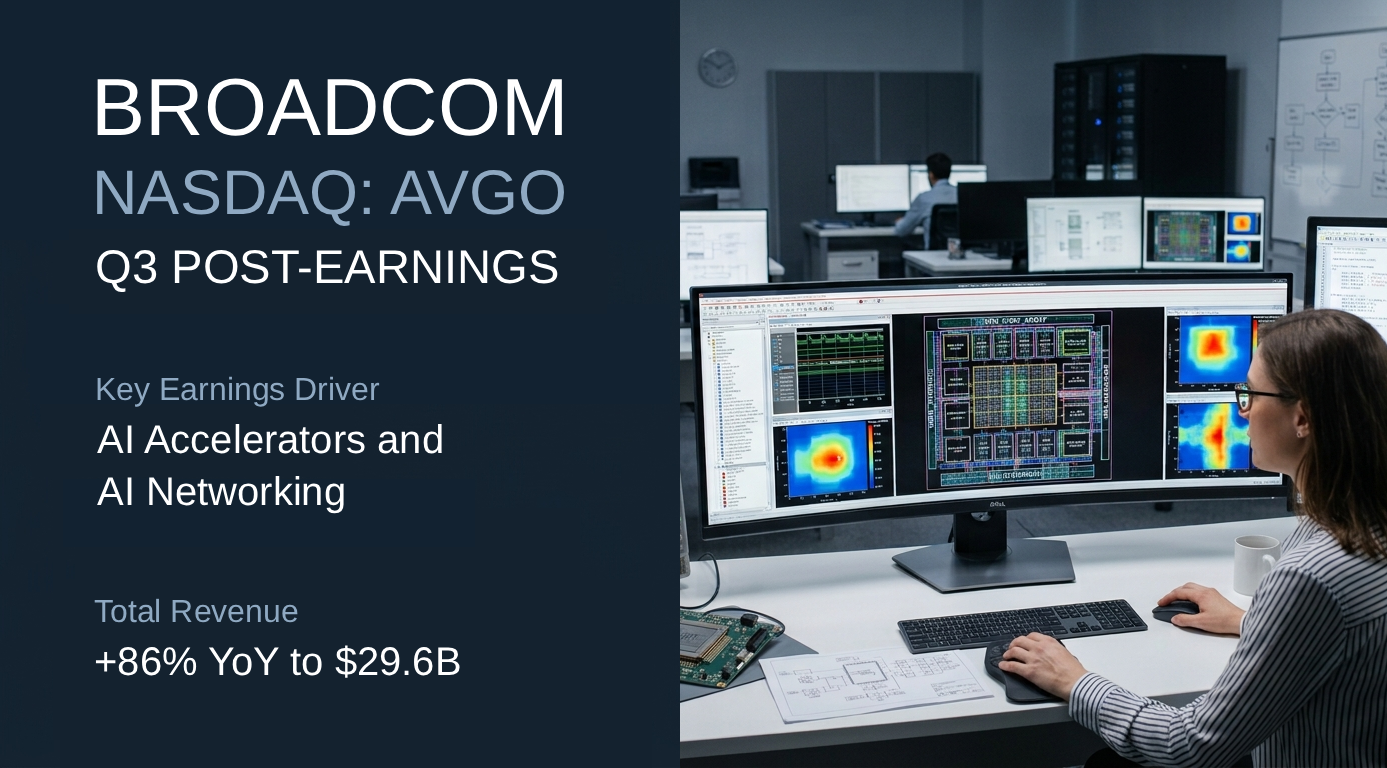
Broadcom (NASDAQ: AVGO) — Q3 FY2026 Post Earnings

Broadcom avgo q3 26 post earnings

Operations

As of September 3, 2026
Q3 Revenue ↑ 86% YoY $29.6B
Divisions
Semiconductor Solutions 70.4%
Infrastructure Software 29.6%

Key Earnings Driver

AI Accelerators and AI Networking Semiconductor Solutions revenue increased 127% year over year to $20.8B. Within Semiconductor Solutions, AI semiconductor revenue increased 221% to $16.7B, driven by strong demand for custom AI accelerators and AI networking. Infrastructure Software revenue increased 29% to $8.8B. Management expects AI semiconductor revenue to reach $21.7B in Q4.

Key Operating Metrics¹

METRIC

STATUS

Semiconductor Solutions↑ 127%

AI Accelerators

🟢 Scaling

AI Networking

🟢 Scaling

Infrastructure Software↑ 29%

Key Financial Metrics

Gross Margin 69.13% +2.04 pp YoY
Backlog / Revenue N/A
CapEx Intensity 1.80% 0.01x Revenue

Key Operating Metrics¹: Core operating metrics relevant to revenue, sourced from website and/or SEC filings for Q, with status based on reported data.
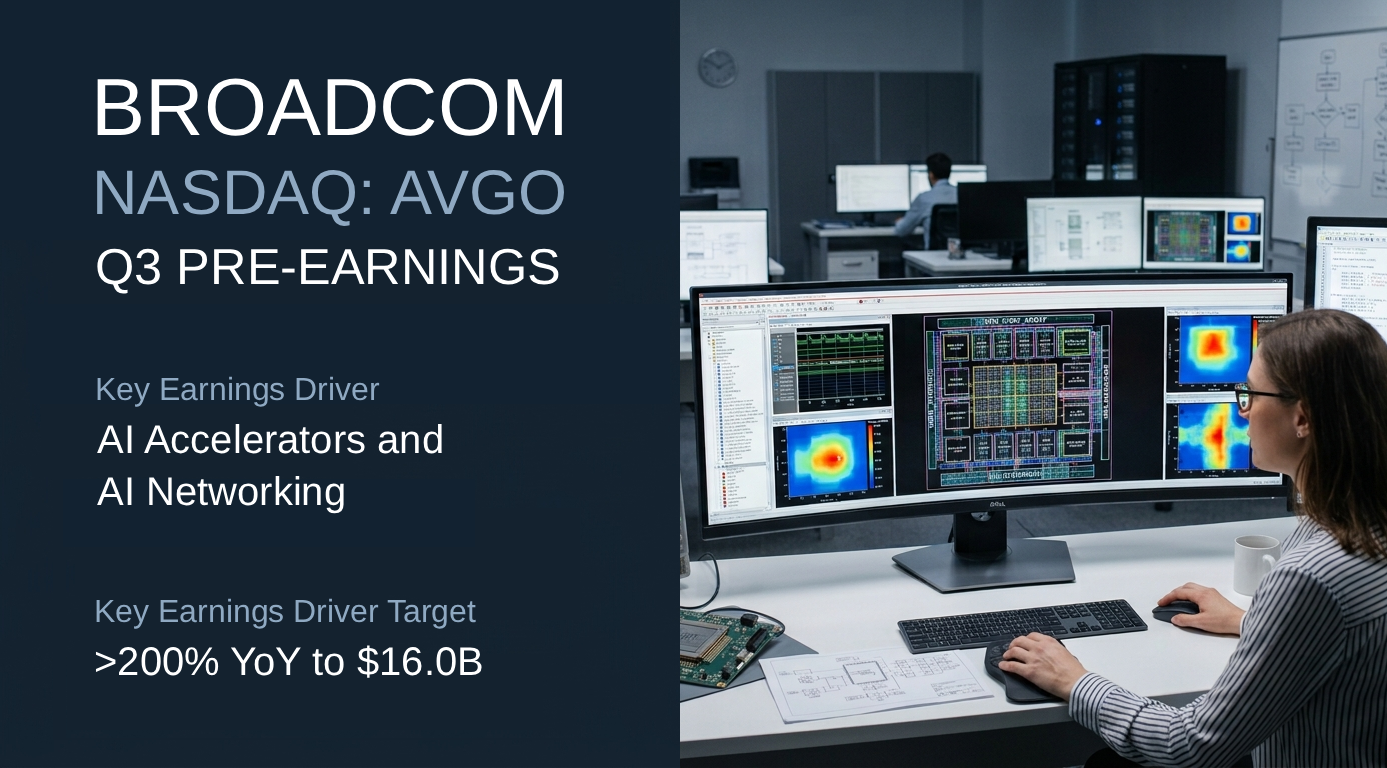
Broadcom (NASDAQ: AVGO) — Q3 FY2026 Pre Earnings

Broadcom avgo q3 26 pre earnings finance note

Operations

As of September 2, 2026
Q2 Revenue ↑ 48% YoY $22.2B
Divisions
Semiconductor Solutions 67.6%
Infrastructure Software 32.4%

Key Earnings Driver

AI Accelerators and AI Networking Semiconductor Solutions revenue increased 79% year over year to $15.0B. Within Semiconductor Solutions, AI semiconductor revenue increased 143% to $10.8B, driven by increasing demand for custom AI Accelerators and AI Networking. Infrastructure Software revenue increased 9% to $7.2B, primarily driven by VMware Cloud Foundation. For Q3, Hock Tan, President and CEO of Broadcom, expects semiconductor revenue from AI to grow more than 200% year over year to $16.0B.

Key Operating Metrics¹

METRIC

STATUS

Semiconductor Solutions↑ 79%

AI Accelerators

🟢 Scaling

AI Networking

🟢 Scaling

Infrastructure Software↑ 9%

VMware Cloud Foundation

Key Financial Metrics

Gross Margin 69.47% +1.51 pp YoY
Backlog / Revenue N/A
CapEx Intensity 1.04% 0.01x Revenue

Key Operating Metrics¹: Core operating metrics relevant to revenue, sourced from website and/or SEC filings for Q, with status based on reported data.

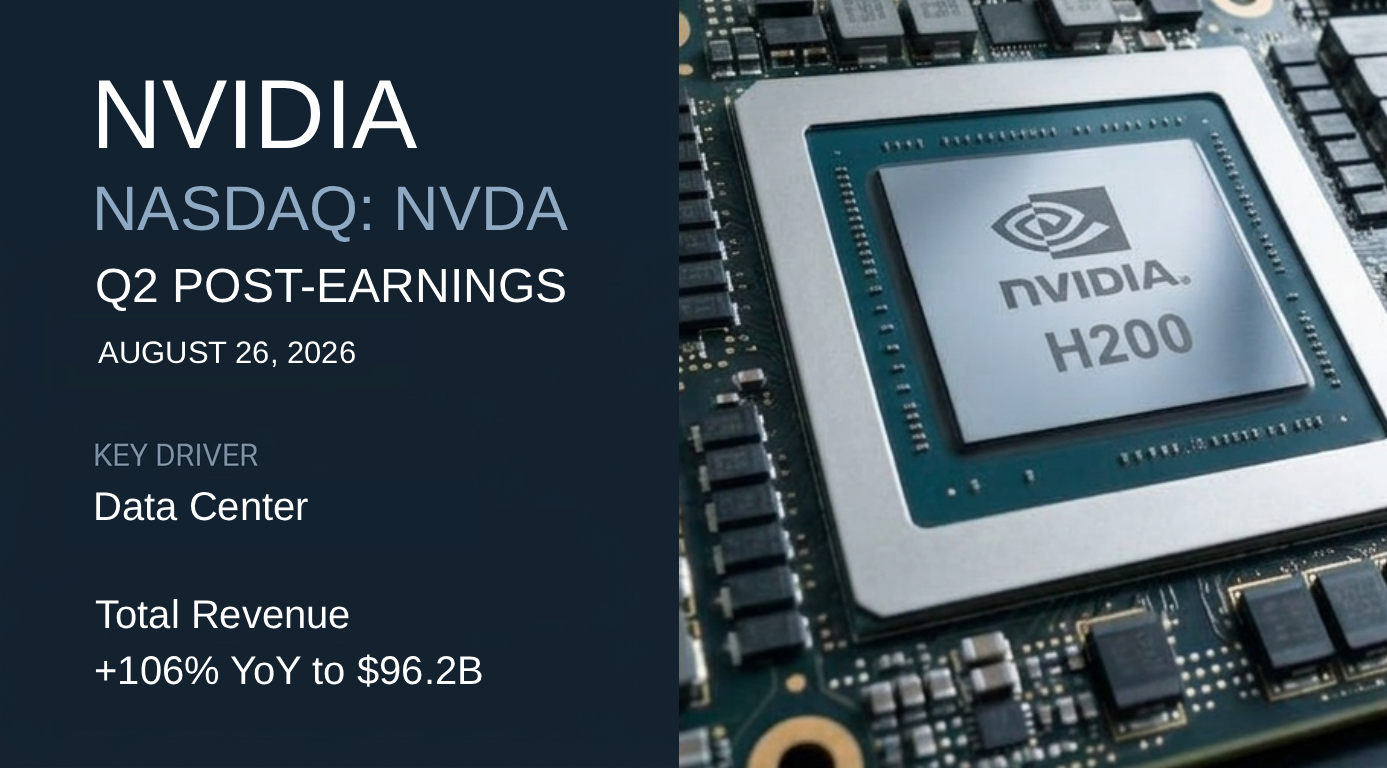
NVIDIA (NASDAQ: NVDA) — Q2 FY2027 Post Earnings

NVIDIA Q2 2027 Post Earnings

Operations

As of August 26, 2026
Q2 Revenue ↑ 106% YoY $96.2B
Divisions
Data Center 92.5%
Edge Computing 7.5%

Key Earnings Driver

Data Center Data Center revenue increased 117% to $89.0 billion, representing 92.5% of total revenue. Within Data Center, NVIDIA announced the NVIDIA Vera Rubin platform is ramping into full production, and NVIDIA Blackwell led across every category in the MLPerf Training 6.0 benchmarks. Edge Computing revenue increased 27% to $7.2 billion.

Key Operating Metrics¹

METRIC

STATUS

Data Center↑ 117%

🟢 Scaling

Key Financial Metrics

Gross Margin 75.00% +2.6 pp YoY
Backlog / Revenue N/A
CapEx Intensity 2.78% 0.02x Revenue

Key Operating Metrics¹: Core operating metrics relevant to revenue, sourced from website and/or SEC filings for Q, with status based on reported data.