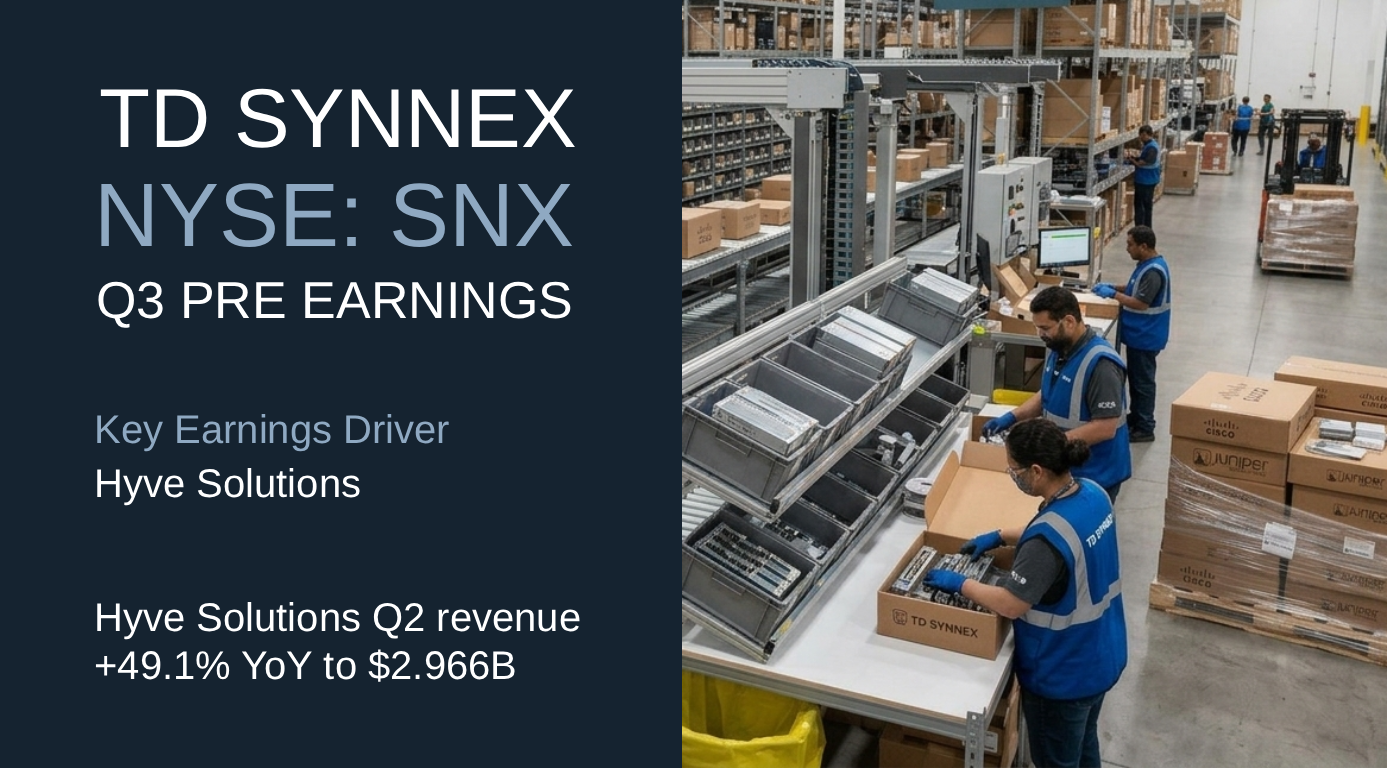
TD Synnex (NYSE: SNX) — Q3 FY2026 Pre Earnings

TD Synnex SNX q3 pre earnings

Operations

As of September 21, 2026
Q2 Revenue ↑ 31% YoY $19.57B
Divisions
Americas Distribution 48.8%
Europe Distribution 30.9%
APJ Distribution 5.2%
Hyve Solutions 15.1%

Key Earnings Driver

Hyve Solutions Americas Distribution revenue increased 27.5% year over year to $9.545B, Europe Distribution increased 29.2% to $6.044B, APJ Distribution increased 28.5% to $1.020B, and Hyve Solutions increased 49.1% to $2.966B. Management stated they delivered a record quarter with broad-based strength across Distribution and Hyve.

Key Operating Metrics¹

METRIC

STATUS

Americas Distribution↑ 27.5%

Europe Distribution↑ 29.2%

Hyve Solutions↑ 49.1%

🟢 Scaling

Key Financial Metrics

Gross Margin 6.84% -0.16 pp YoY
Backlog / Revenue N/A
CapEx Intensity 0.34% 0.00x Revenue

Key Operating Metrics¹: Core operating metrics relevant to revenue, sourced from website and/or SEC filings for Q, with status based on reported data.
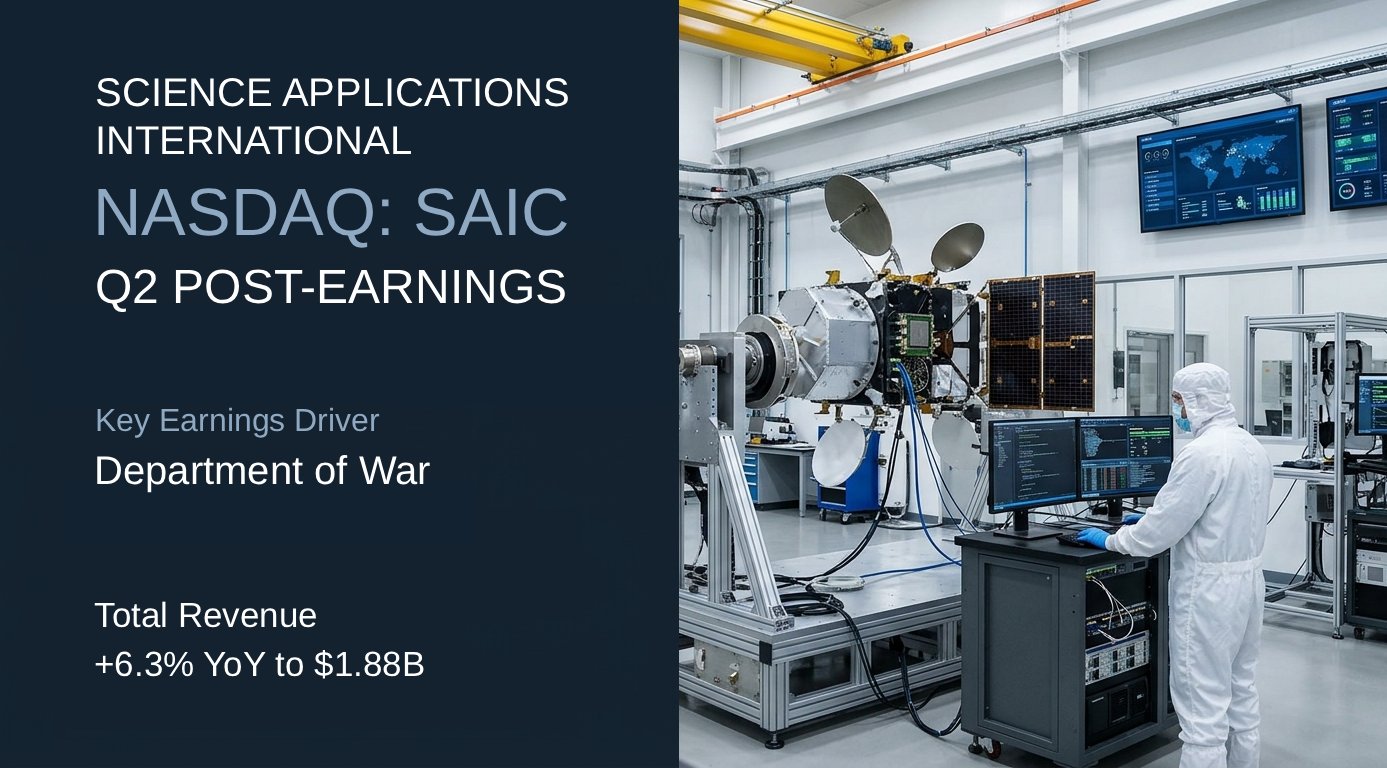
Science Applications International (NASDAQ: SAIC) — Q2 FY2027 Post Earnings

Science Applications International SAIC q2 post earnings

Operations

As of September 1, 2026
Q2 Revenue ↑ 6.3% YoY $1.88B
Divisions
Defense and Intelligence 77.1%
Civilian 22.9%

Key Earnings Driver

Department of War Defense and Intelligence revenue increased 5% year over year to $1.45B. Within Defense and Intelligence, Department of War revenue increased 7.17% to $986M, representing 68% of the division’s revenue. Civilian revenue increased 9% to $431M from $395M.

Key Operating Metrics¹

METRIC

STATUS

Defense and Intelligence↑ 5%

Department of War↑ 7%

🟢 Scaling

Civilian↑ 9%

Key Financial Metrics

Gross Margin 12.71% +0.56 pp YoY
Backlog / Revenue 1,177.4% 11.77x Qtr Rev
CapEx Intensity N/A

Key Operating Metrics¹: Core operating metrics relevant to revenue, sourced from website and/or SEC filings for Q, with status based on reported data.

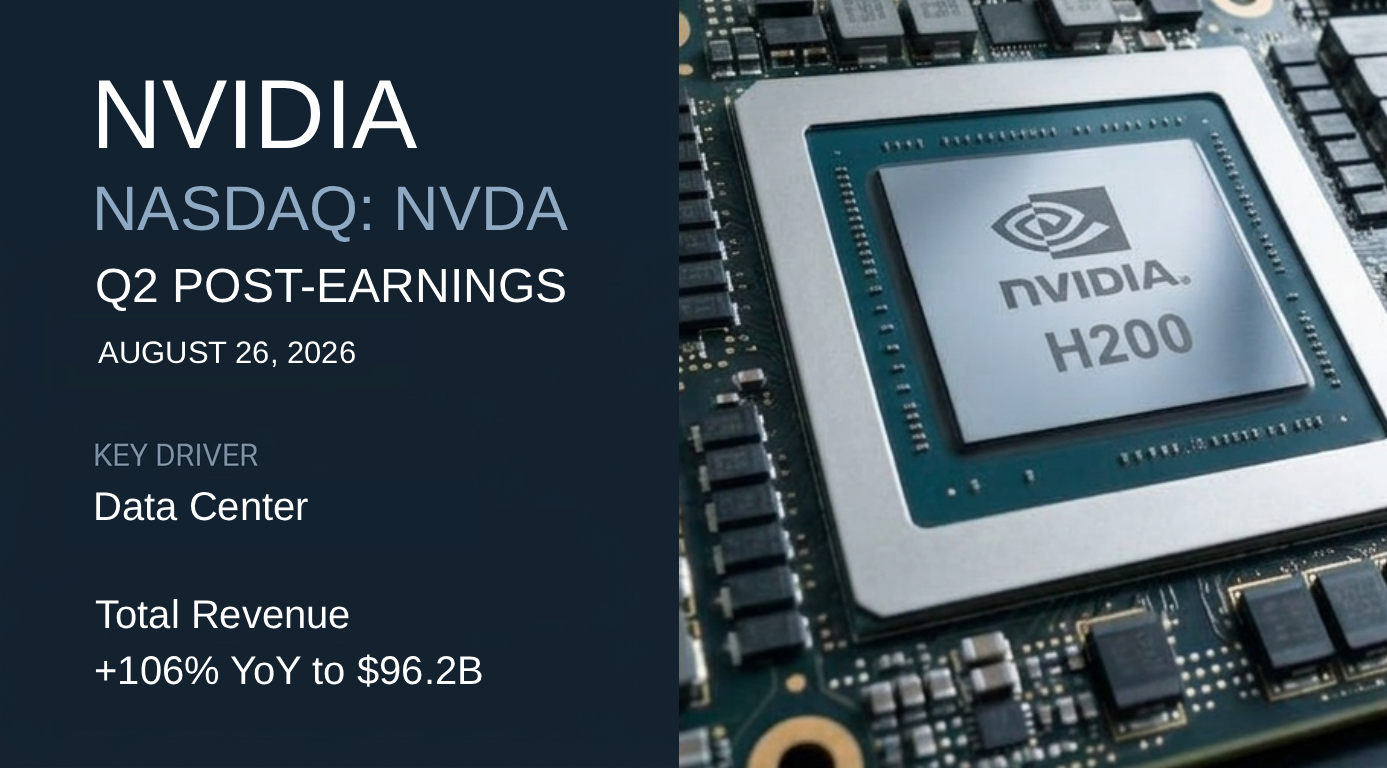
NVIDIA (NASDAQ: NVDA) — Q2 FY2027 Post Earnings

NVIDIA Q2 2027 Post Earnings

Operations

As of August 26, 2026
Q2 Revenue ↑ 106% YoY $96.2B
Divisions
Data Center 92.5%
Edge Computing 7.5%

Key Earnings Driver

Data Center Data Center revenue increased 117% to $89.0 billion, representing 92.5% of total revenue. Within Data Center, NVIDIA announced the NVIDIA Vera Rubin platform is ramping into full production, and NVIDIA Blackwell led across every category in the MLPerf Training 6.0 benchmarks. Edge Computing revenue increased 27% to $7.2 billion.

Key Operating Metrics¹

METRIC

STATUS

Data Center↑ 117%

🟢 Scaling

Key Financial Metrics

Gross Margin 75.00% +2.6 pp YoY
Backlog / Revenue N/A
CapEx Intensity 2.78% 0.02x Revenue

Key Operating Metrics¹: Core operating metrics relevant to revenue, sourced from website and/or SEC filings for Q, with status based on reported data.