See what’s really behind a stock
Find which companies sell a product, where it fits within their business and how that part of the business performs.
What you get
Find and compare companies
- Companies and ProductsFind which companies sell a product and see where it sits in their reported revenue segments.
- Revenue and GrowthCompare the size and year-over-year growth of those revenue segments.
- Company ExposureSee how much of each company’s revenue comes from segments containing the product.
Go deeper into metrics
- Product OverlapSee which other mapped products share those revenue segments.
- Combined MetricsCompare combined segment revenue and growth across companies.
- Verified SourcesTrace each product to its official company source and each revenue figure to the original SEC filing.
- From company filingsCompany revenue segments exactly as companies report them in their SEC filings.
- As granular as filings allowEach product sits in the lowest segment that reports revenue.
- Nasdaq 100 and S&P 100 liveS&P 500 coming next.
Try a search
5 free searches, no account needed.

Finance Notes
Concise finance notes highlighting the key driver behind a company’s earnings or a company catalyst.
Latest Finance Notes
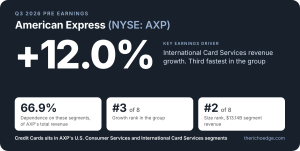
- American Express (NYSE: AXP) — Q3 2026 Pre Earnings
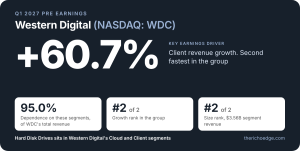
- Western Digital (NASDAQ: WDC) — Q1 FY2027 Pre Earnings
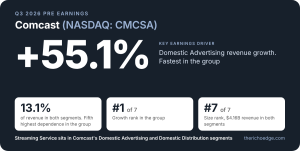
- Comcast (NASDAQ: CMCSA) — Q3 2026 Pre Earnings
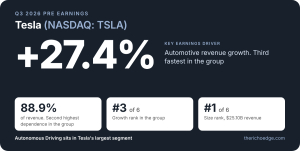
- Tesla (NASDAQ: TSLA) — Q3 2026 Pre Earnings
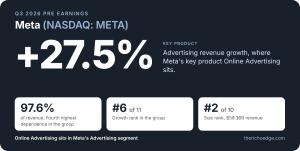
- Meta Platforms (NASDAQ: META) — Q3 2026 PRE EARNINGS
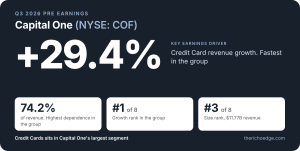
- Capital One Financial (NYSE: COF) — Q3 2026 Pre Earnings