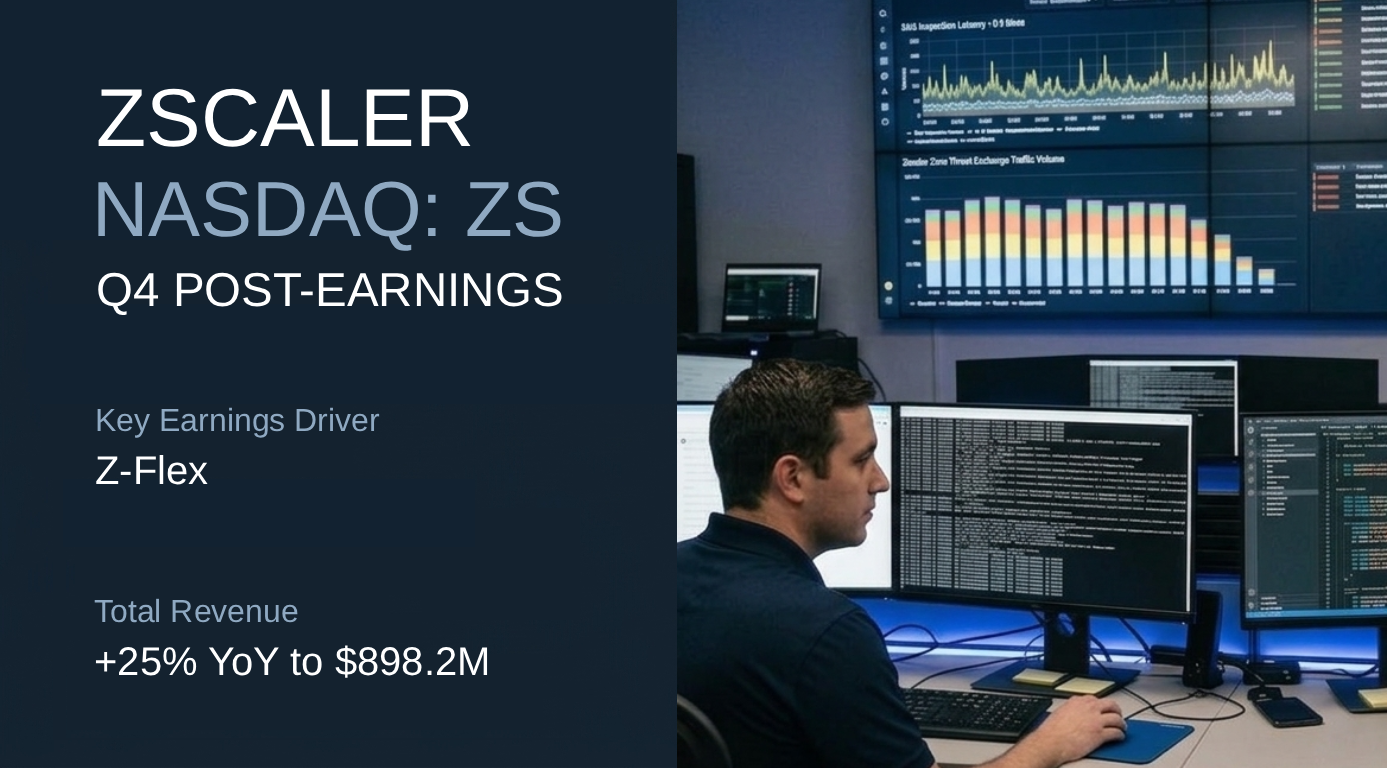
Zscaler (NASDAQ: ZS) — Q4 FY2026 Post Earnings

Zscaler ZS q4 post earnings finance note

Operations

As of September 5, 2026
Q4 Revenue ↑ 25% YoY $898.2M
Divisions
Zscaler 100.0%

Key Earnings Driver

Z-Flex Zscaler revenue increased 25% year over year to $898.2M. Within Zscaler, Z-Flex TCV exceeded $770M in Q4, increasing more than 60% quarter over quarter, and exceeded $1.7B for FY2026. Management cited increasing contribution from non-seat-based solutions and continued Z-Flex momentum.

Key Operating Metrics¹

METRIC

STATUS

Zscaler↑ 25%

Z-Flex

🟢 Scaling

Key Financial Metrics

Gross Margin 77.00% +1 pp YoY
Backlog / Revenue 819.8% 8.19x Qtr Rev
CapEx Intensity 22.25% 0.22x Revenue

Key Operating Metrics¹: Core operating metrics relevant to revenue, sourced from website and/or SEC filings for Q, with status based on reported data.
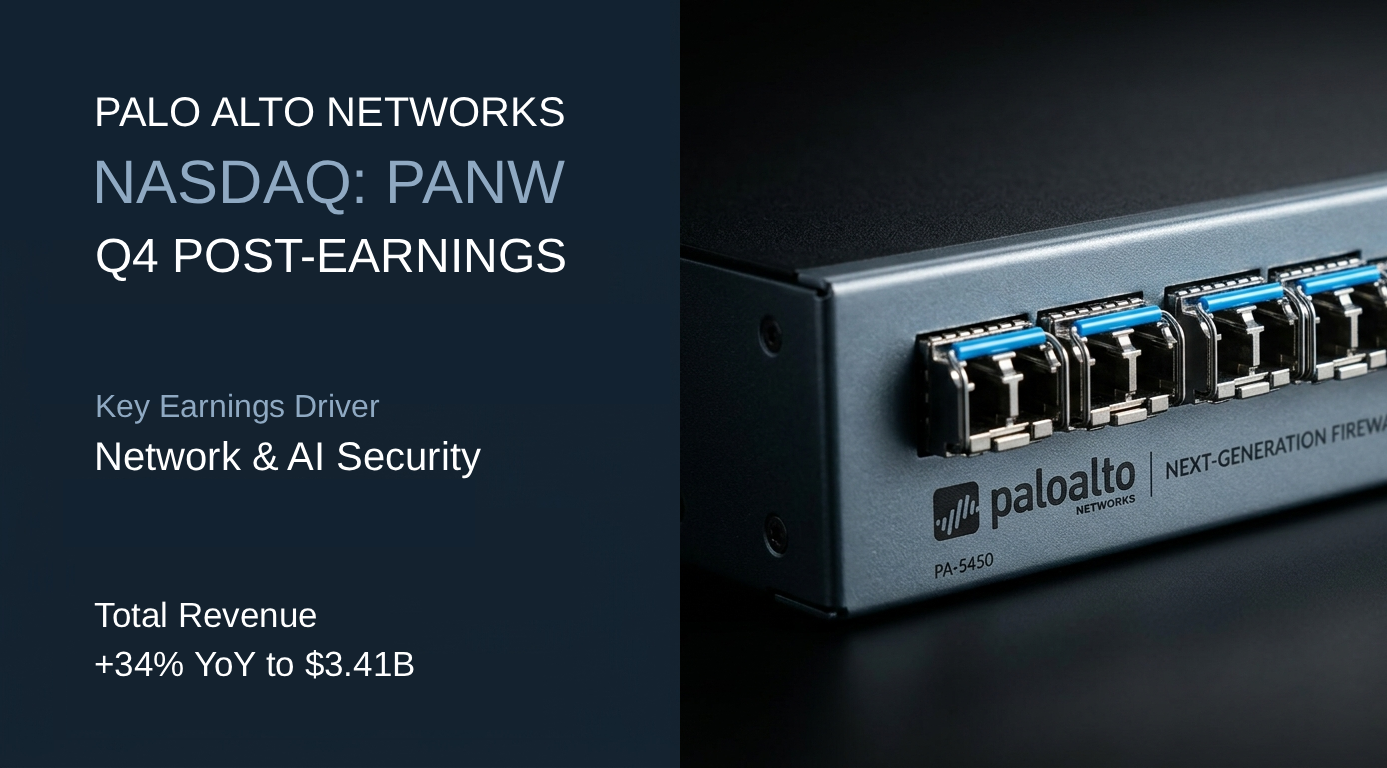
Palo Alto Networks (NASDAQ: PANW) — Q4 FY2026 Post Earnings

Palo Alto Networks panw q4 26 Post Earnings

Operations

As of September 2, 2026
Q4 Revenue ↑ 34% YoY $3.41B
Divisions
Network & AI Security 68.4%
Cortex 17.2%
Idira 9.8%
Other 4.6%

Key Earnings Driver

Network & AI Security Network & AI Security revenue increased 17% year over year to $2.3B. Cortex revenue increased 25% to $586M. Idira revenue increased 21% pro forma to $336M. Other revenue increased 5% to $157M. Network & AI Security represented 68% of revenue and was the largest reported platform. Management attributed the quarter’s strength to Network & AI Security, Cortex, and Idira.

Key Operating Metrics¹

METRIC

STATUS

Network & AI Security↑ 17%

🟢 Scaling

Cortex↑ 25%

Key Financial Metrics

Gross Margin 74.80% -1 pp YoY
Backlog / Revenue 621.7% 6.21x Qtr Rev
CapEx Intensity 3.02% 0.03x Revenue

Key Operating Metrics¹: Core operating metrics relevant to revenue, sourced from website and/or SEC filings for Q, with status based on reported data.