

Concentrix (NASDAQ: CNXC) — Q3 2026 Post Earnings

Post earnings note company quarterly analysis

Operations

Q3 2026
Q3 Revenue ↓ 1.2% YoY $2.45B
Segments
Technology & Consumer Electronics 24.6%
Retail, travel and e-commerce 27.0%
Communications and media 15.6%
Banking, financial services and insurance 17.6%
Healthcare 5.9%
Other 9.3%

Key Earnings Driver

Banking, Financial Services and Insurance Technology and Consumer Electronics revenue decreased 10% year over year to $603.5M, Retail, Travel and E-Commerce revenue increased 6% to $662.6M, Communications and Media revenue decreased 7% to $381.9M, while Banking, Financial Services and Insurance revenue increased 12% to $432.5M.

Key Operating Metrics¹

METRIC

STATUS

Technology and Consumer Electronics↓ 10.0%

🟡 Watch

Retail, Travel and E–Commerce↑ 6.0%

Communications & Media↓ 7.0%

🟡 Watch

Banking, Financial Services and Insurance↑ 12.0%

🟢 Scaling

Key Operating Metrics¹: Core operating metrics relevant to revenue, sourced from website and/or SEC filings for Q, with status based on reported data.

NetSol Technologies (NASDAQ: NTWK) — Q4 FY2026 Post Earnings

NetSol Technologies Q4 26 post earnings

Operations

Q4 2026
Q4 Revenue ↑ 12.5% YoY $20.7M
Segments
Services 56.6%
Subscription and Support 43.2%
License 0.2%

Key Earnings Driver

Services Services revenue increased 21.3% year over year to $11.70M. Total Services revenues increased 3.3% for FY2026 to $33.6M as the company progressed major implementations. Subscription and Support revenue rose 9.0% to $8.90M, and License revenue decreased 93.1% to $36,260.

Key Operating Metrics¹

METRIC

STATUS

Services↑ 21.3%

🟢 Scaling

Subscription and Support↑ 9.0%

License↓ 93.1%

🟡 Watch

Key Operating Metrics¹: Core operating metrics relevant to revenue, sourced from website and/or SEC filings for Q, with status based on reported data.
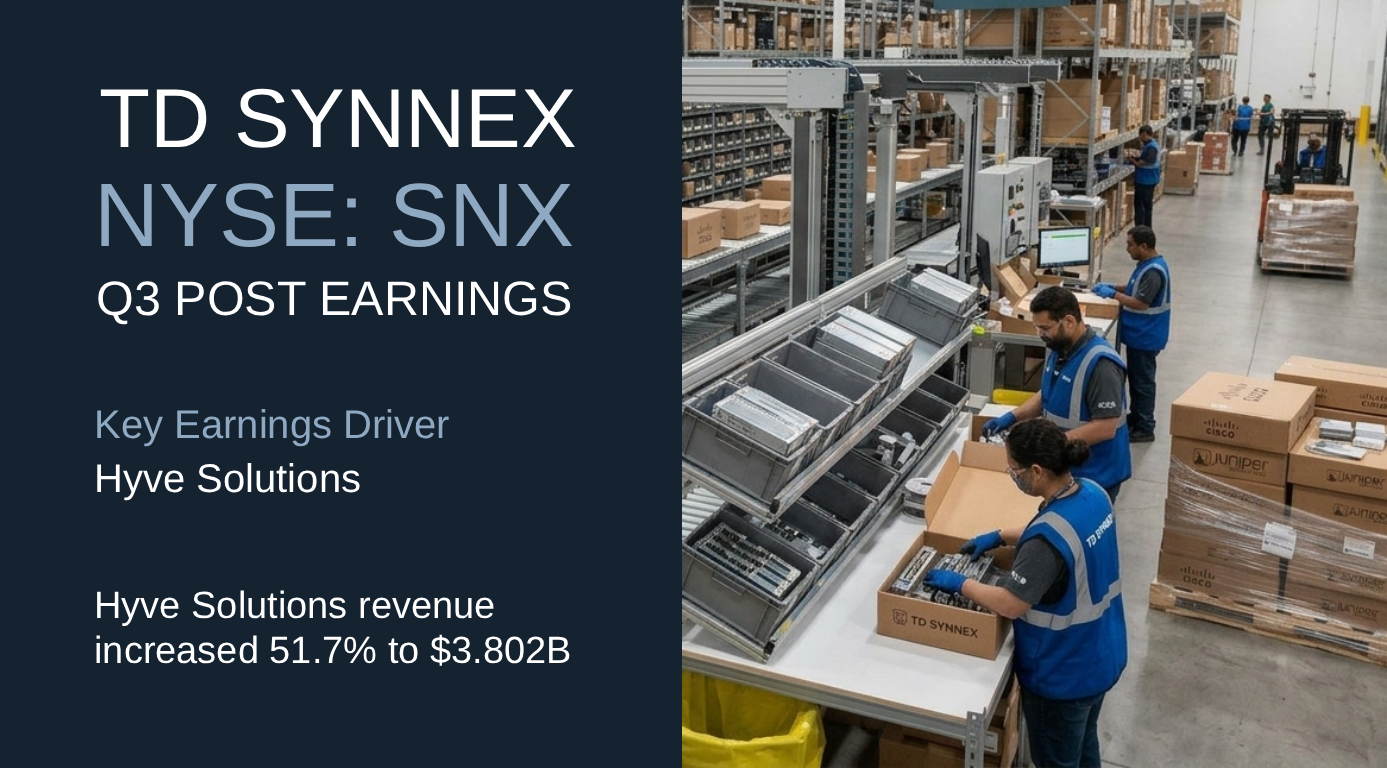
TD Synnex (NYSE: SNX) — Q3 FY2026 Post Earnings

TD Synnex SNX q3 pre earnings finance note

Operations

Q3 2026
Q3 Revenue ↑ 37.7% YoY $21.56B
Segments
Americas Distribution 47.9%
Europe Distribution 29.5%
APJ Distribution 5.0%
Hyve Solutions 17.6%

Key Earnings Driver

Hyve Solutions Americas Distribution revenue increased 39.9% year over year to $10.319B, Europe Distribution revenue increased 30.2% to $6.366B, APJ Distribution revenue increased 21.7% to $1.071B, and Hyve Solutions revenue increased 51.7% to $3.802B. Management stated they delivered another record quarter, with Distribution and Hyve both performing above our expectations and growing above market.

Key Operating Metrics¹

METRIC

STATUS

Americas Distribution↑ 39.9%

Europe Distribution↑ 30.2%

Hyve Solutions↑ 51.7%

🟢 Scaling

Key Financial Metrics

Gross Margin 6.61% -0.61 pp YoY
Backlog / Revenue N/A
CapEx Intensity 0.27% 0.00x Revenue

Key Operating Metrics¹: Core operating metrics relevant to revenue, sourced from website and/or SEC filings for Q, with status based on reported data.

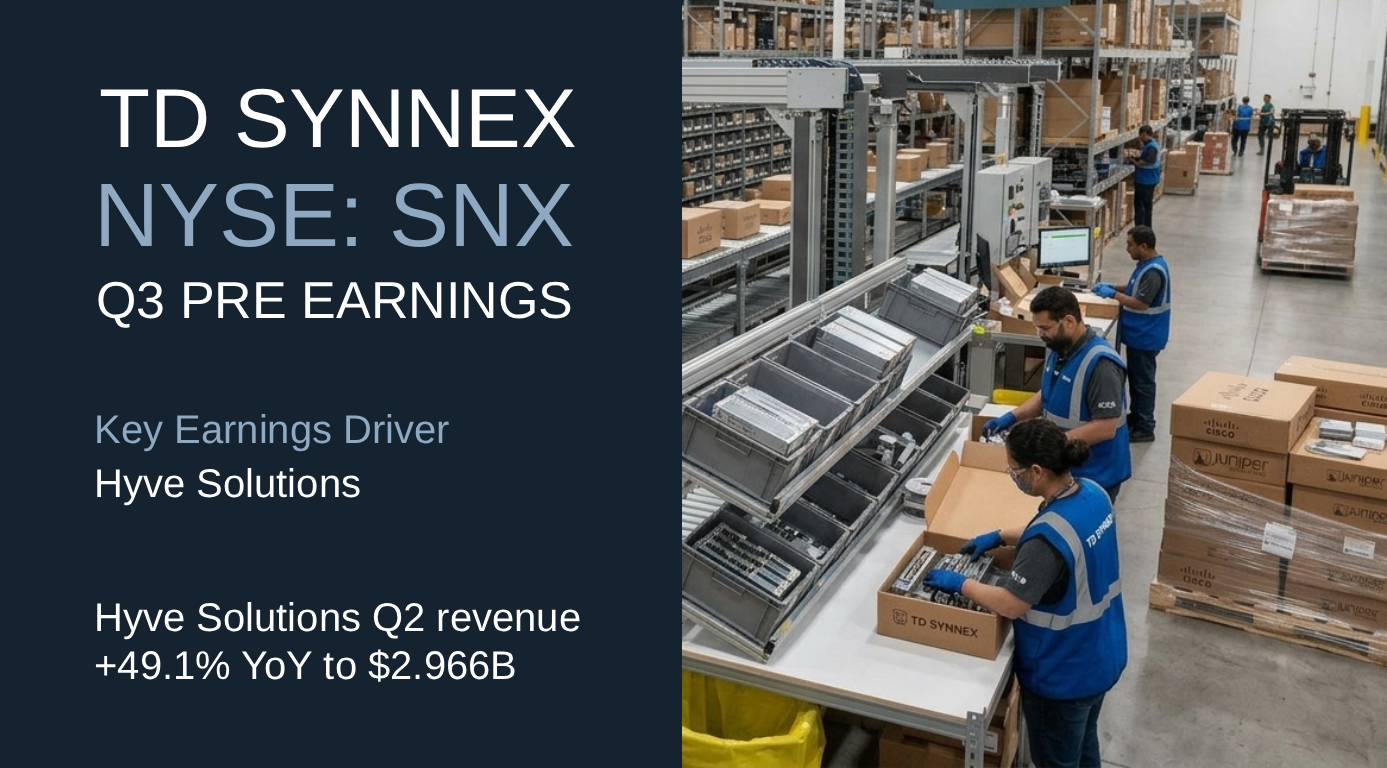
TD Synnex (NYSE: SNX) — Q3 FY2026 Pre Earnings

TD Synnex SNX q3 pre earnings

Operations

Q2 2026
Q2 Revenue ↑ 31.0% YoY $19.57B
Segments
Americas Distribution 48.8%
Europe Distribution 30.9%
APJ Distribution 5.2%
Hyve Solutions 15.1%

Key Earnings Driver

Hyve Solutions Americas Distribution revenue increased 27.5% year over year to $9.545B, Europe Distribution revenue increased 29.2% to $6.044B, APJ Distribution revenue increased 28.5% to $1.020B, and Hyve Solutions revenue increased 49.1% to $2.966B. Management stated they delivered a record quarter with broad-based strength across Distribution and Hyve.

Key Operating Metrics¹

METRIC

STATUS

Americas Distribution↑ 27.5%

Europe Distribution↑ 29.2%

Hyve Solutions↑ 49.1%

🟢 Scaling

Key Financial Metrics

Gross Margin 6.84% -0.16 pp YoY
Backlog / Revenue N/A
CapEx Intensity 0.34% 0.00x Revenue

Key Operating Metrics¹: Core operating metrics relevant to revenue, sourced from website and/or SEC filings for Q, with status based on reported data.

Oracle (NYSE: ORCL) — Q1 FY2027 Post Earnings

Oracle ORCL q1 27 post earnings Finance Note

Operations

Q1 2027
Q1 Revenue ↑ 29.6% YoY $19.35B
Segments
Cloud and Software 88.7%
Hardware 4.0%
Services 7.3%

Key Earnings Driver

Cloud Infrastructure Cloud and Software revenue increased 32.9% year over year, with Cloud revenue increasing 61.5% to $11.6B, while Software revenue declined 3% to $5.5B. Within Cloud, Cloud Applications revenue increased 9.9% to $4.2B and Cloud Infrastructure revenue increased 120.7% to $7.4B. Hardware revenue increased 15.5% to $0.8B, and Services revenue increased 4.8% to $1.4B. Oracle’s Q1 total revenue increase reflected strong execution in its Cloud Infrastructure business, with the delivery of 850MW additional datacenter capacity.

Key Operating Metrics¹

METRIC

STATUS

Cloud and Software↑ 32.9%

Cloud↑ 61.5%

Cloud Infrastructure↑ 120.7%

🟢 Scaling

Cloud Applications↑ 9.9%

Software↓ 3.0%

Software License↓ 14.5%

🟡 Watch

Software Support↓ 1.2%

🟡 Watch

Key Financial Metrics

Gross Margin 60.03% -4.7 pp YoY
Backlog / Revenue 3,431.9% 34.31x Qtr Rev
CapEx Intensity 147.32% 1.47x Revenue

Key Operating Metrics¹: Core operating metrics relevant to revenue, sourced from website and/or SEC filings for Q, with status based on reported data.

Oracle (NYSE: ORCL) — Q1 FY2027 Pre Earnings

Pre earnings note company quarterly analysis

Operations

Q4 2026
Q4 Revenue ↑ 20.6% YoY $19.18B
Segments
Cloud and Software 87.3%
Hardware 4.8%
Services 7.9%

Key Earnings Driver

Multicloud AI Database Cloud and Software revenue increased 22.1% year over year, with Cloud revenue increasing 47.1% to $9.9B, while Software declined 2.1% to $6.8B. Within Cloud, Cloud Infrastructure revenue increased 93.2% to $5.8B, with management reporting that Multicloud AI Database increased 404% and was its fastest-growing business ever, and Cloud Applications revenue increased 10.3% to $4.1B. Hardware increased 8.7% to $0.9B, and Services increased 13.0% to $1.5B.

Key Operating Metrics¹

METRIC

STATUS

Cloud and Software↑ 22.1%

Cloud↑ 47.1%

Cloud Infrastructure↑ 93.3%

Multicloud AI Database↑ 404.0%

🟢 Scaling

Cloud Applications↑ 10.2%

Software↓ 2.1%

Software License↓ 6.3%

🟡 Watch

Software Support↓ 0.4%

🟡 Watch

Key Operating Metrics¹: Core operating metrics relevant to revenue, sourced from website and/or SEC filings for Q, with status based on reported data.