
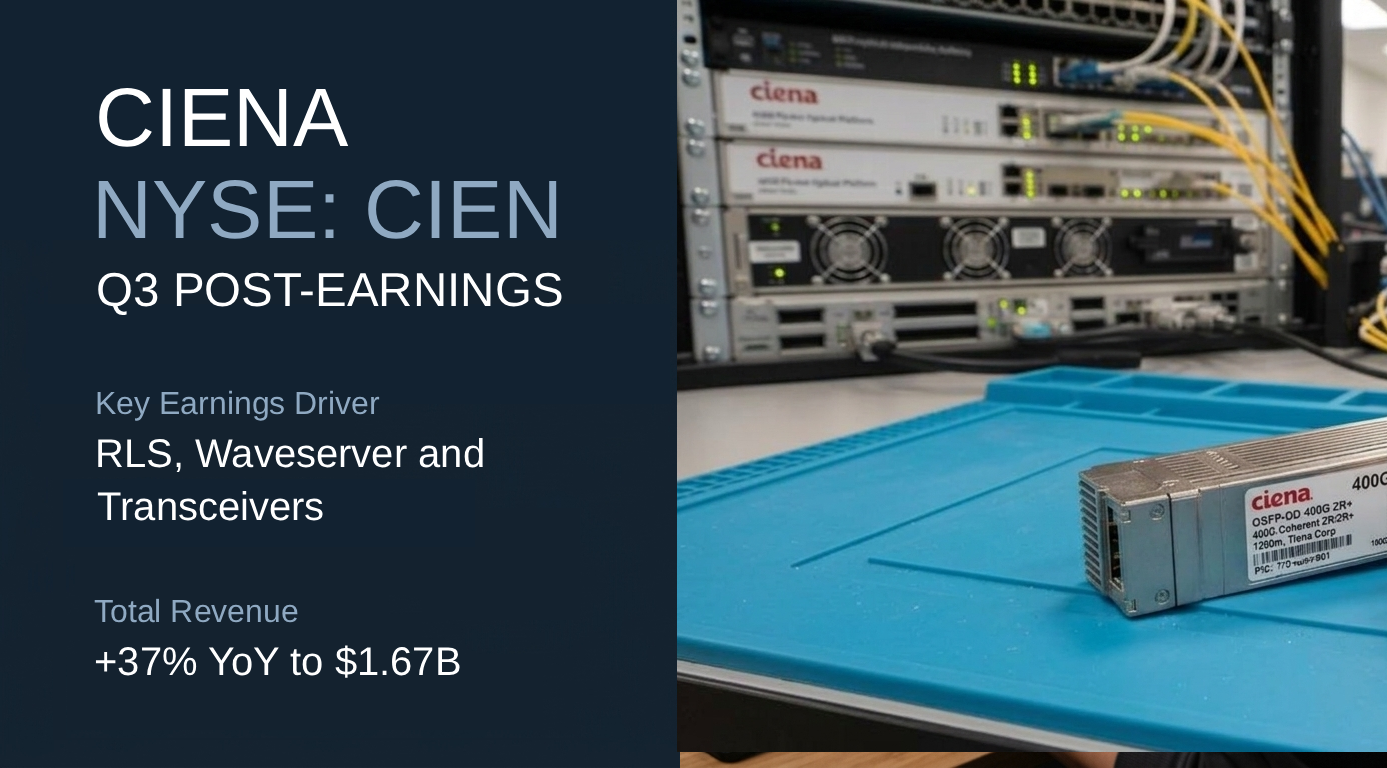
Ciena (NYSE: CIEN) — Q3 FY2026 Post Earnings

Ciena q3 26 post earnings Finance Note

Operations

Q3 2026
Q3 Revenue ↑ 37.0% YoY $1.67B
Segments
Networking Platforms 81.1%
Platform Software and Services 5.9%
Blue Planet Automation Software and Services 1.4%
Global Services 11.6%

Key Earnings Driver

RLS, Waveserver and Transceivers Networking Platforms revenue increased 44.0% year over year to $1.36B. Within Networking Platforms, Optical Networking revenue increased 46.1% to $1.19B, driven by increased sales of 6500 Reconfigurable Line Systems, Waveserver systems and coherent pluggable transceivers, and Routing and Switching revenue increased 30.6% to $164.4M. Platform Software and Services revenue increased 9.7% to $98.6M, Blue Planet Automation Software and Services revenue declined 16.5% to $23.2M, and Global Services revenue increased 20.8% to $193.6M. On the earnings call, CFO Marc Graff said RLS and Waveserver each grew more than 55%.

Key Operating Metrics¹

METRIC

STATUS

Networking Platforms↑ 44.0%

Optical Networking↑ 46.1%

6500 Reconfigurable Line Systems

🟢 Scaling

Waveserver

🟢 Scaling

Coherent pluggable transceivers

🟢 Scaling

Routing and Switching↑ 30.6%

Global Services↑ 20.8%

Maintenance, Support, and Learning↑ 11.3%

Implementation↑ 33.4%

Advisory and Enablement↑ 16.3%

Key Financial Metrics

Gross Margin 45.40% +4.1 pp YoY
Backlog / Revenue 508.6% 5.08x Qtr Rev
CapEx Intensity N/A

Key Operating Metrics¹: Core operating metrics relevant to revenue, sourced from website and/or SEC filings for Q, with status based on reported data.
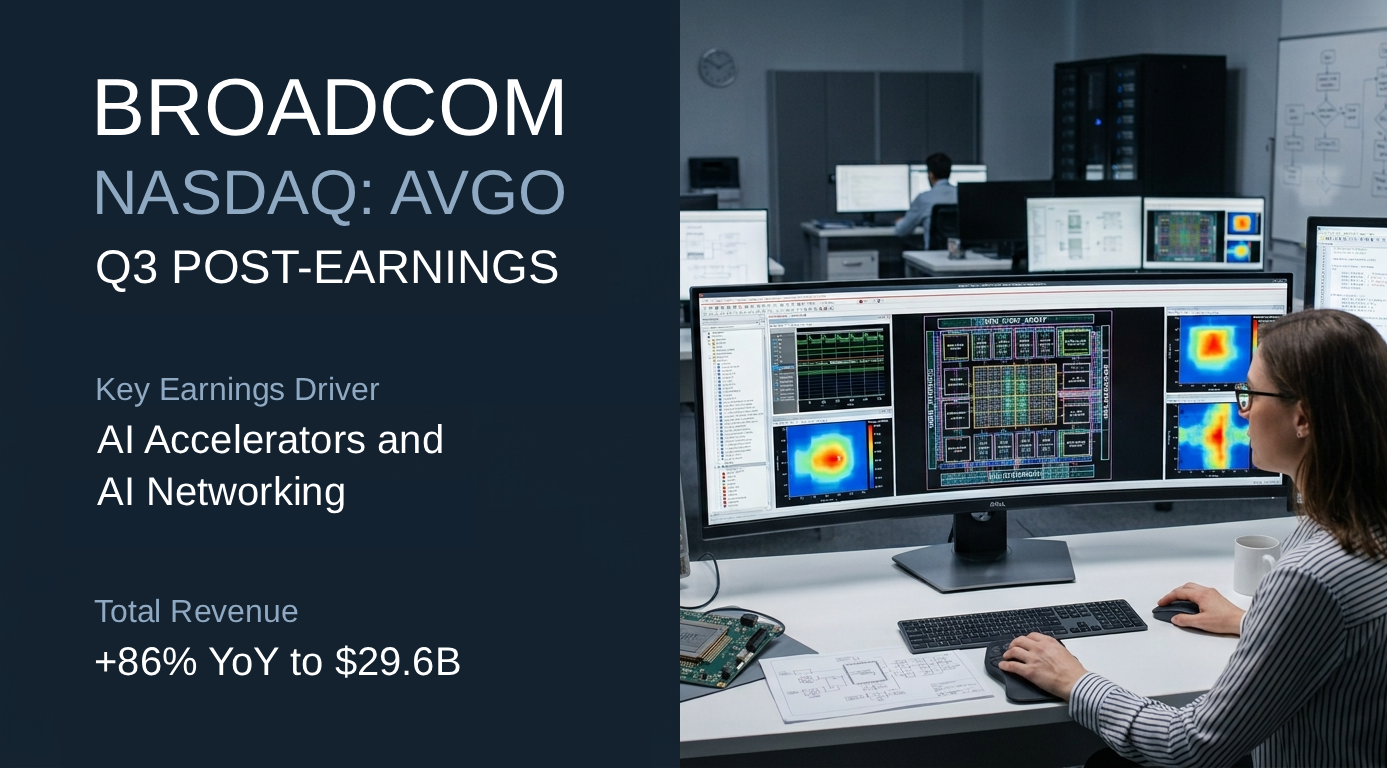
Broadcom (NASDAQ: AVGO) — Q3 FY2026 Post Earnings

Broadcom avgo q3 26 post earnings

Operations

Q3 2026
Q3 Revenue ↑ 85.5% YoY $29.59B
Segments
Semiconductor Solutions 70.4%
Infrastructure Software 29.6%

Key Earnings Driver

AI Accelerators and AI Networking Semiconductor Solutions revenue increased 127.4 year over year to $20.8B. Within Semiconductor Solutions, AI semiconductor revenue increased 221.0% to $16.7B, driven by strong demand for custom AI accelerators and AI networking. Infrastructure Software revenue increased 29.0% to $8.8B. Management expects AI semiconductor revenue to reach $21.7B in Q4.

Key Operating Metrics¹

METRIC

STATUS

Semiconductor Solutions↑ 127.4%

AI semiconductor↑ 221.0%

AI Accelerators

🟢 Scaling

AI Networking

🟢 Scaling

Non-AI Semiconductor

Infrastructure Software↑ 29.0%

Key Financial Metrics

Gross Margin 69.13% +2.04 pp YoY
Backlog / Revenue N/A
CapEx Intensity 1.80% 0.01x Revenue

Key Operating Metrics¹: Core operating metrics relevant to revenue, sourced from website and/or SEC filings for Q, with status based on reported data.
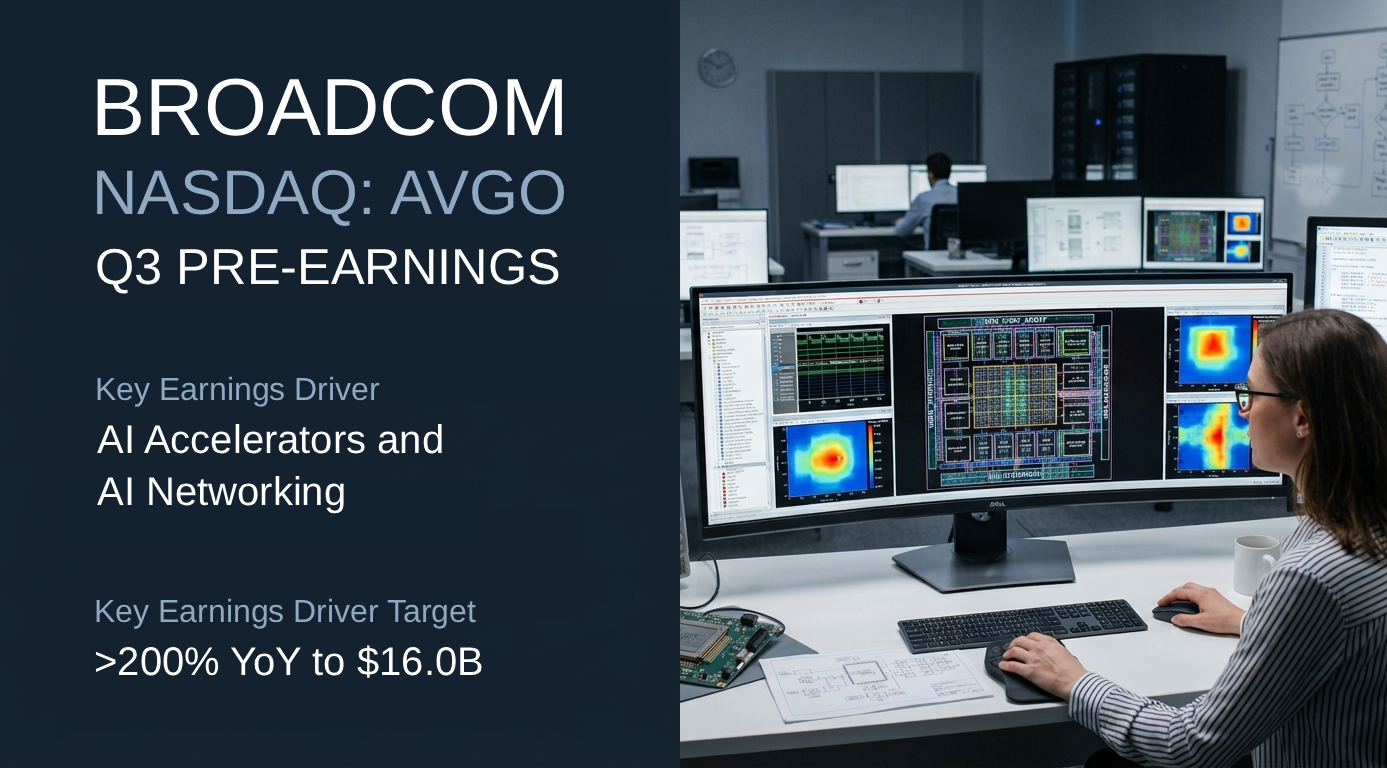
Broadcom (NASDAQ: AVGO) — Q3 FY2026 Pre Earnings

Broadcom avgo q3 26 pre earnings finance note

Operations

Q2 2026
Q2 Revenue ↑ 47.9% YoY $22.19B
Segments
Semiconductor Solutions 67.6%
Infrastructure Software 32.4%

Key Earnings Driver

AI Accelerators and AI Networking Semiconductor Solutions revenue increased 78.5% year over year to $15.0B. Within Semiconductor Solutions, AI semiconductor revenue increased 143.0% to $10.8B, driven by increasing demand for custom AI Accelerators and AI Networking. Infrastructure Software revenue increased 8.8% to $7.2B, primarily driven by VMware Cloud Foundation. For Q3, Hock Tan, President and CEO of Broadcom, expects semiconductor revenue from AI to grow more than 200% year over year to $16.0B.

Key Operating Metrics¹

METRIC

STATUS

Semiconductor Solutions↑ 78.5%

AI semiconductor↑ 143.0%

AI Accelerators

🟢 Scaling

AI Networking

🟢 Scaling

Infrastructure Software↑ 8.8%

VMware Cloud Foundation

Key Financial Metrics

Gross Margin 69.47% +1.51 pp YoY
Backlog / Revenue N/A
CapEx Intensity 1.04% 0.01x Revenue

Key Operating Metrics¹: Core operating metrics relevant to revenue, sourced from website and/or SEC filings for Q, with status based on reported data.

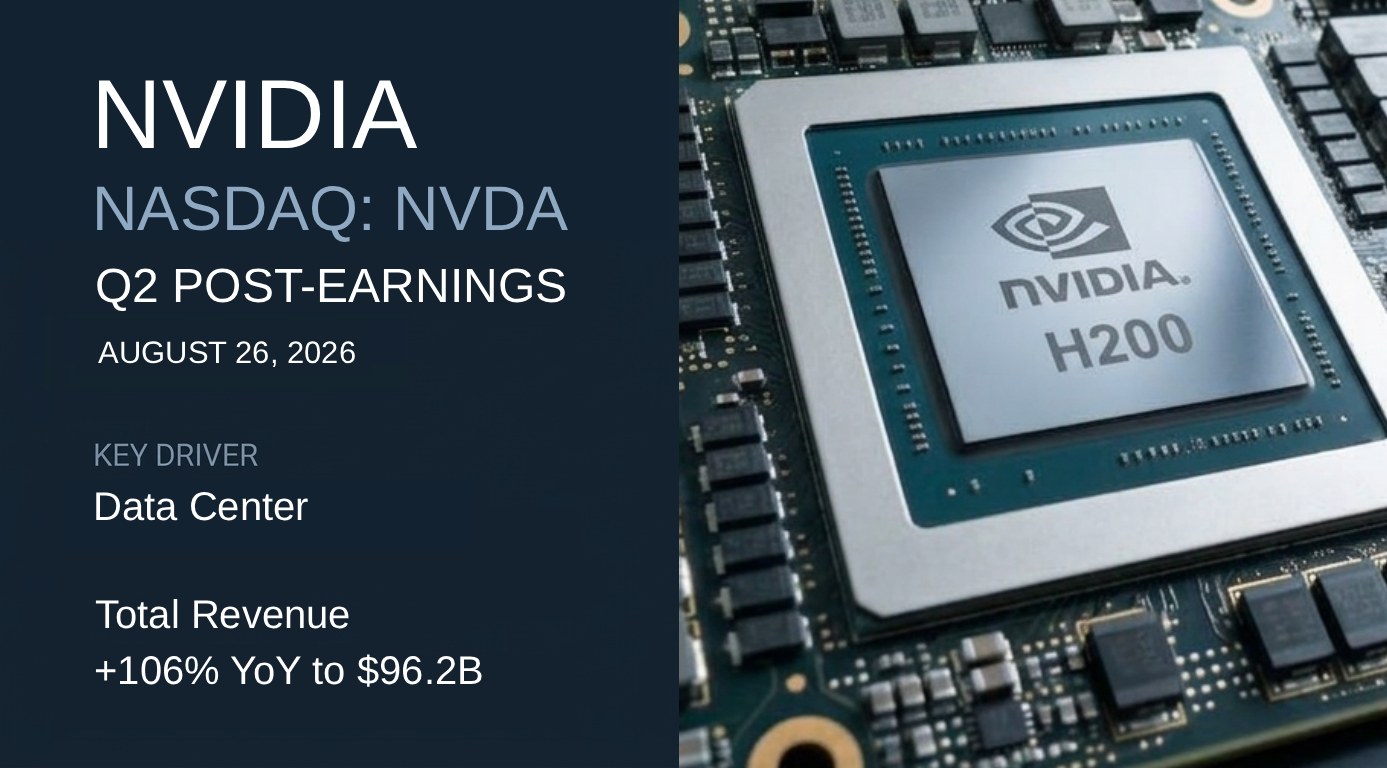
NVIDIA (NASDAQ: NVDA) — Q2 FY2027 Post Earnings

NVIDIA Q2 2027 Post Earnings

Operations

Q2 2027
Q2 Revenue ↑ 105.9% YoY $96.22B
Segments
Data Center 92.5%
Edge Computing 7.5%

Key Earnings Driver

AI Clouds, Industrial, & Enterprise Data Center revenue increased 116.6% to $89.0B, representing 92.5% of total revenue. Within Data Center, AI Clouds, Industrial, & Enterprise revenue increased 138.1% to $40.3B. NVIDIA announced the NVIDIA Vera Rubin platform is ramping into full production, and NVIDIA Blackwell led across every category in the MLPerf Training 6.0 benchmarks. Edge Computing revenue increased 27.5% to $7.2B.

Key Operating Metrics¹

METRIC

STATUS

Data Center↑ 116.6%

Hyperscale↑ 101.5%

AI Clouds, Industrial, & Enterprise↑ 138.1%

🟢 Scaling

Key Financial Metrics

Gross Margin 75.00% +2.6 pp YoY
Backlog / Revenue N/A
CapEx Intensity 2.78% 0.02x Revenue

Key Operating Metrics¹: Core operating metrics relevant to revenue, sourced from website and/or SEC filings for Q, with status based on reported data.

Ubiquiti Inc. (NYSE: UI) — Q4 FY2026 Post Earnings

Post earnings note company quarterly analysis

Operations

Q4 2026
Q4 Revenue ↑ 23.5% YoY $937.3M
Segments
Enterprise Technology 92.6%
Service Provider Technology 7.4%

Key Earnings Driver

Enterprise Technology Enterprise Technology revenue increased 27.7% year over year to $868.3M. Ubiquiti stated that the growth in revenues over the prior quarter and the comparable prior year periods was driven by an increase in revenue from its Enterprise Technology platform. Service Provider Technology revenue declined 12.7% to $69.0M.

Key Operating Metrics¹

METRIC

STATUS

Enterprise Technology↑ 27.7%

🟢 Scaling

Key Financial Metrics

Gross Margin 45.80% +0.7 pp YoY
Backlog / Revenue N/A
CapEx Intensity 0.58% 0.00x Revenue

Key Operating Metrics¹: Core operating metrics relevant to revenue, sourced from website and/or SEC filings for Q, with status based on reported data.

Ubiquiti Inc. (NYSE: UI) — Q4 FY2026 Pre Earnings

Pre earnings note company quarterly analysis

Operations

Q3 2026
Q3 Revenue ↑ 18.7% YoY $788.2M
Segments
Enterprise Technology 91.1%
Service Provider Technology 8.9%

Key Earnings Driver

Enterprise Technology Enterprise Technology revenue increased 22.6% year over year to $717.9M, compared with $585.7M in the same period a year earlier. The company attributed the increase in Enterprise Technology revenue to growth from its Enterprise Technology platform across all regions. Service Provider Technology revenue declined 10.3% to $70.3M.

Key Operating Metrics¹

METRIC

STATUS

Enterprise Technology↑ 22.6%

🟢 Scaling

Key Operating Metrics¹: Core operating metrics relevant to revenue, sourced from website and/or SEC filings for Q, with status based on reported data.

Cisco (NASDAQ: CSCO) — Q4 FY2026 Post Earnings

Post earnings note company quarterly analysis

Operations

Q4 2026
Q4 Revenue ↑ 17.6% YoY $17.25B
Segments
Networking 56.7%
Security 12.9%
Collaboration 6.8%
Observability 1.6%
Services 22.0%

Key Earnings Driver

AI Infrastructure Networking revenue increased 28.3% year over year to $9.8B. Within Networking, AI infrastructure revenue reached approximately $4B for FY2026, up approximately 300% from $1B, and AI infrastructure orders reached $9.3B. Security revenue increased 14% to $2.23B, Collaboration revenue increased 12% to $1.17B, Observability revenue increased 6.2% to $275M, while Services revenue increased 0.2% to $3.79B.

Key Operating Metrics¹

METRIC

STATUS

Networking↑ 28.3%

AI Infrastructure

🟢 Scaling

Security↑ 14.0%

Services↑ 0.2%

Key Operating Metrics¹: Core operating metrics relevant to revenue, sourced from website and/or SEC filings for Q, with status based on reported data.

Cisco (NASDAQ: CSCO) — Q4 FY2026 Pre Earnings

Pre earnings note company quarterly analysis

Operations

Q3 2026
Q3 Revenue ↑ 12.0% YoY $15.84B
Segments
Networking 55.6%
Security 12.7%
Collaboration 6.5%
Observability 1.7%
Services 23.5%

Key Earnings Driver

AI Infrastructure Networking revenue increased 24.7% year over year to $8.8B. Within Networking, Cisco reported $5.3B in AI infrastructure orders year to date through Q3 FY2026, with the company expecting FY2026 AI infrastructure orders to reach $9B and AI infrastructure revenue to reach $4B. Security revenue declined 0.2% to $2.0B, Collaboration revenue decreased 0.7% to $1.0B, Observability revenue increased 3.1% to $269M, while Services revenue declined 1.4% to $3.7B.

Key Operating Metrics¹

METRIC

STATUS

Networking↑ 24.7%

AI Infrastructure

🟢 Scaling

Security↓ 0.2%

🟡 Watch

Services↓ 1.4%

🟡 Watch

Key Operating Metrics¹: Core operating metrics relevant to revenue, sourced from website and/or SEC filings for Q, with status based on reported data.