
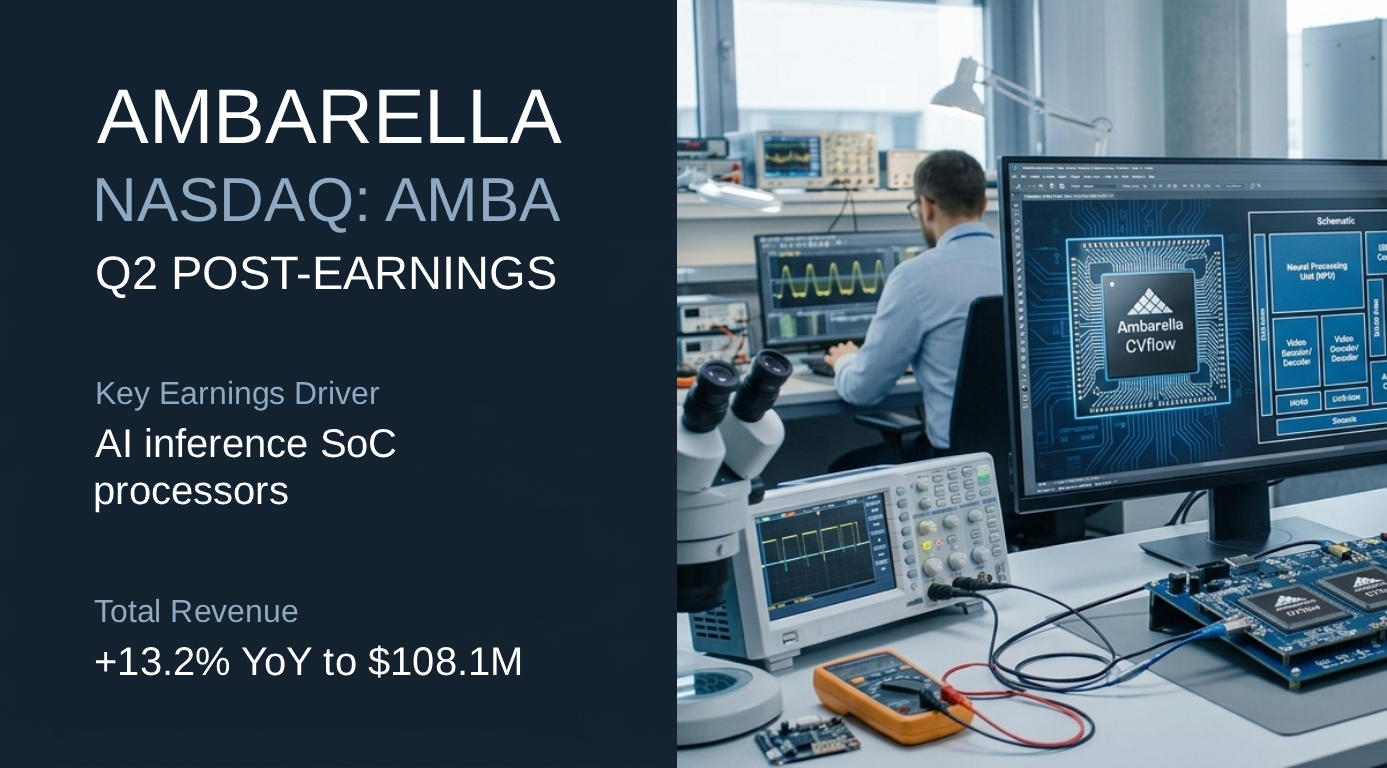
Ambarella (NASDAQ: AMBA) — Q2 FY2027 Post Earnings

Ambarella q2 27 posst earnings

Operations

Q2 2027
Q2 Revenue ↑ 13.2% YoY $108.1M
Segments
Ambarella 100.0%

Key Earnings Driver

AI inference SoC processors Ambarella revenue increased 13.2% year over year to $108.1M. Within Ambarella, Edge AI revenue reached record levels in Q2, with balanced sequential growth in Auto and IoT markets and very strong growth from its 5nm CV75 and CV72 AI inference SoC processors.

Key Operating Metrics¹

METRIC

STATUS

Ambarella↑ 13.2%

Edge AI

CV75 AI inference SoC processors

🟢 Scaling

CV72 AI inference SoC processors

🟢 Scaling

Key Financial Metrics

Gross Margin 57.70% -1.2 pp YoY
Backlog / Revenue N/A
CapEx Intensity 6.31% 0.06x Revenue

Key Operating Metrics¹: Core operating metrics relevant to revenue, sourced from website and/or SEC filings for Q, with status based on reported data.


Baidu (NASDAQ: BIDU) — Q2 2026 Post Earnings

Post earnings note company quarterly analysis

Operations¹

Q2 2026
Q2 Revenue ↓ 4.2% YoY ¥31.33B
Segments
Baidu General Business 80.0%
iQIYI 20.0%

Key Earnings Driver

GPU Cloud Baidu General Business revenue declined 4% year over year to RMB25.2 billion, with Online Marketing Services declining 19% to RMB13.1 billion, while Others revenue increased 21% to RMB12.1 billion and GPU Cloud revenue within Others increased 283%. iQIYI revenue declined 5% to RMB6.3 billion.

Key Operating Metrics²

METRIC

STATUS

Baidu General Business↓ 4.0%

Online Marketing Services↓ 19.0%

🟡 Watch

Others↑ 21.0%

GPU Cloud↑ 283.0%

🟢 Scaling

iQIYI↓ 5.0%

Membership Services↓ 2.0%

🟡 Watch

Online Advertising Services↓ 2.0%

🟡 Watch

Content Distribution↑ 56.0%

Other↓ 58.0%

🟡 Watch

Operations¹: Total revenue is after inter-segment elimination. Division revenue percentages are before inter-segment elimination.

Key Operating Metrics²: Core operating metrics relevant to revenue, sourced from website and/or SEC filings for Q, with status based on reported data.

Baidu (NASDAQ: BIDU) — Q2 2026 Pre Earnings

Pre earnings note company quarterly analysis

Operations¹

Q1 2026
Q1 Revenue ↓ 1.2% YoY ¥32.08B
Segments
Baidu General Business 80.7%
iQIYI 19.3%

Key Earnings Driver

GPU Cloud Baidu General Business revenue increased 2% year over year to RMB26.0B. with Online Marketing Services declining 22% to RMB12.6 billion, while Others revenue increased 42% to RMB13.4 billion and GPU Cloud revenue within Others increased 184%. iQIYI revenue declined 14% to RMB6.2B.

Key Operating Metrics²

METRIC

STATUS

Baidu General Business↑ 2.0%

Online Marketing Services↓ 22.0%

🟡 Watch

Others↑ 42.0%

GPU Cloud↑ 184.0%

🟢 Scaling

iQIYI↓ 13.0%

Membership Services↓ 5.0%

🟡 Watch

Online Advertising Services↓ 7.0%

🟡 Watch

Content Distribution↓ 43.0%

🟡 Watch

Other↓ 49.0%

🟡 Watch

Operations¹: Total revenue is after inter-segment elimination. Division revenue percentages are before inter-segment elimination.

Key Operating Metrics²: Core operating metrics relevant to revenue, sourced from website and/or SEC filings for Q, with status based on reported data.

Nebius Group (NASDAQ: NBIS) — Q2 2026 Post Earnings

Post earnings note company quarterly analysis

Operations¹

Q2 2026
Q2 Revenue ↑ 454.0% YoY $582.3M
Segments
Nebius AI cloud 98.1%
Avride 0.2%
TripleTen 1.7%

Key Earnings Driver

Nebius AI Cloud Nebius AI cloud revenue increased 514% to $574.9M representing 98% of group revenue. Management attributed revenue growth to capacity added in Q1, higher utilization, and high margin revenue from Token Factory and recent acquisitions.

Key Operating Metrics²

METRIC

STATUS

Nebius AI Cloud↑ 513.6%

Token Factory

🟢 Scaling

Key Financial Metrics

Gross Margin 77.10% +6 pp YoY
Backlog / Revenue N/A
CapEx Intensity 971.56% 9.71x Revenue

Operations¹: Total revenue is after inter-segment elimination. Division revenue percentages are before inter-segment elimination.

Key Operating Metrics²: Core operating metrics relevant to revenue, sourced from website and/or SEC filings for Q, with status based on reported data.

Nebius Group (NASDAQ: NBIS) — Q2 2026 Pre Earnings

Pre earnings note company quarterly analysis

Operations¹

Q1 2026
Q1 Revenue ↑ 683.9% YoY $399M
Segments
Nebius AI cloud 96.9%
Avride 0.2%
TripleTen 2.9%

Key Earnings Driver

Nebius AI Cloud Nebius AI cloud revenue increased 841% to $389.7M. Management attributed group revenue growth to capacity scaling, supported by pricing and utilization.

Key Operating Metrics²

METRIC

STATUS

Nebius AI Cloud↑ 841.3%

🟢 Scaling

Key Financial Metrics

Gross Margin 74.00% +23 pp YoY
Backlog / Revenue N/A
CapEx Intensity 619.77% 6.19x Revenue

Operations¹: Total revenue is after inter-segment elimination. Division revenue percentages are before inter-segment elimination.

Key Operating Metrics²: Core operating metrics relevant to revenue, sourced from website and/or SEC filings for Q, with status based on reported data.