
RTX (NYSE: RTX) — Q3 2026 Pre Earnings

rtx q3 2026 pre-earnings finance note
What to watch
Tactical Missiles is RTX's leading product

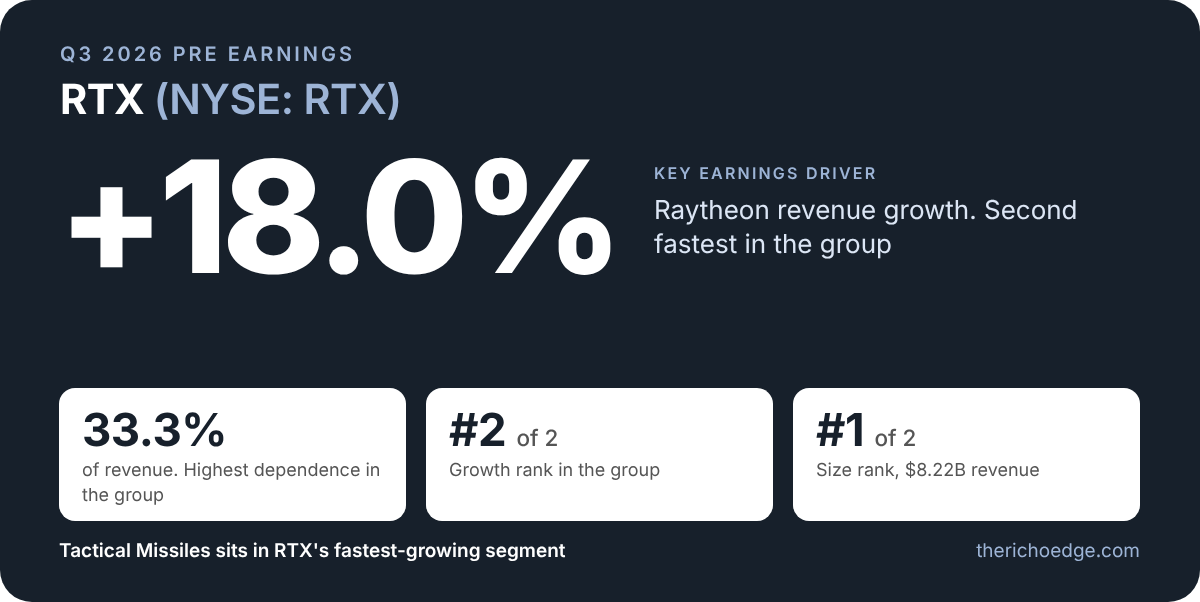
Tactical Missiles sits within RTX’s Raytheon segment, 33.3% of revenue, which grew 18.0%. Lockheed Martin grew faster at 19.5%, but RTX’s segment is twice the size, and RTX depends on it more than its peer.

See every company in Tactical Missiles →
Growth rank
#2 of 2
↑ 18.0% year on year in the reported segment
Size rank
#1 of 2
$8.22B segment revenue
Share of the combined segments
66.7%
of $12.32B across 2 companies that report one
Dependence on this segment
33.3%
of RTX’s total revenue

Who else sells Tactical Missiles

The revenue segment each company reports that contains this product. 2 companies.

CompanyQuarterRevenue segmentSegment revenue% of companyGrowth
RTXQ2 FY2026 · Jun 30, 2026Raytheon$8.22B33.3%↑ 18.0%
LMTQ2 FY2026 · Jun 28, 2026Missiles and Fire Control$4.10B20.4%↑ 19.5%

Peer rank: year-on-year growth

Growth of the reported segment, latest quarter. A company with several segments shows its fastest.

LMT
19.5%
RTX
18.0%

Concentration: share of company revenue

How much of each company’s total revenue sits in the segment above.

RTX
33.3%
LMT
20.4%

Combined segment revenue

The 2 companies that report a segment for this product earned this in those segments in their latest quarters. It is the revenue of the whole reported segment, not of the product alone.

$12.32B

Coverage: Nasdaq 100 and S&P 100 companies mapped to Tactical Missiles (2 companies, 2 disclose a segment). Quarters differ by company; each row shows its own period end date.

Source: Revenue segments as reported in each company’s SEC filings. Products are mapped to segments from company pages.
Open the Tactical Missiles search →

General Electric (NYSE: GE) — Q3 2026 Pre Earnings

ge q3 2026 pre-earnings finance note-card
What to watch
Aircraft Engines is General Electric's leading product

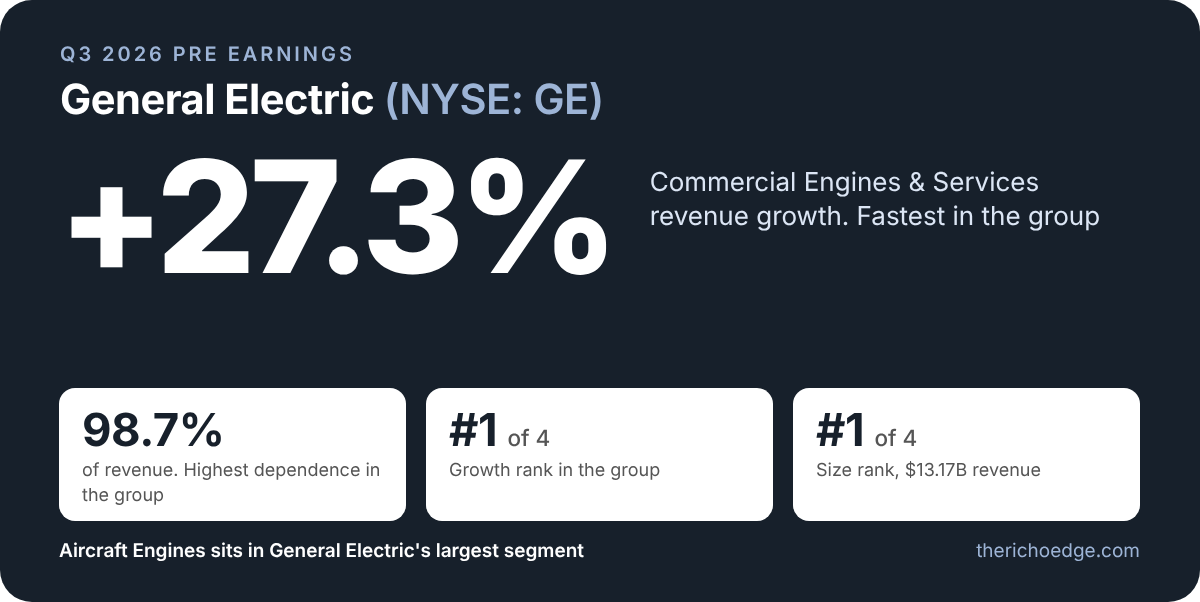
Aircraft Engines sits within General Electric’s Commercial Engines & Services and Defense & Propulsion Technologies segments, together comprising 98.7% of revenue. Commercial Engines & Services, the larger segment, grew 27.3%. No other company grew faster among the four companies in the group, and General Electric depends on it more than any peer.

See every company in Aircraft Engines →
Growth rank
#1 of 4
↑ 27.3% year on year in the reported segment
Size rank
#1 of 4
$13.17B segment revenue
Share of the combined segments
47.1%
of $27.99B across 4 companies that report one
Dependence on this segment
98.7%
of GE’s total revenue

Who else sells Aircraft Engines

The revenue segment each company reports that contains this product. 4 companies.

CompanyQuarterRevenue segmentSegment revenue% of companyGrowth
GEQ2 FY2026 · Jun 30, 2026Commercial Engines & Services$9.73B72.9%↑ 27.3%
GEQ2 FY2026 · Jun 30, 2026Defense & Propulsion Technologies$3.44B25.8%↑ 15.6%
RTXQ2 FY2026 · Jun 30, 2026Pratt & Whitney$8.88B35.9%↑ 16.4%
HONQ2 FY2026 · Jun 30, 2026Commercial Aviation Aftermarket$2.05B21.1%↑ 6.9%
HONQ2 FY2026 · Jun 30, 2026Defense and Space$1.80B18.5%↓ 0.4%
HONQ2 FY2026 · Jun 30, 2026Commercial Aviation Original Equipment$686M7.1%↑ 17.1%
HONAQ2 FY2026 · Jun 27, 2026Engines & Power Systems$1.41B31.1%↑ 1.2%

Peer rank: year-on-year growth

Growth of the reported segment, latest quarter. A company with several segments shows its fastest.

GE
27.3%
HON
17.1%
RTX
16.4%
HONA
1.2%

Concentration: share of company revenue

How much of each company’s total revenue sits in the segment above.

GE
98.7%
HON
46.6%
RTX
35.9%
HONA
31.1%

Combined segment revenue

The 4 companies that report a segment for this product earned this in those segments in their latest quarters. It is the revenue of the whole reported segment, not of the product alone.

$27.99B

Coverage: Nasdaq 100 and S&P 100 companies mapped to Aircraft Engines (4 companies, 4 disclose a segment). Quarters differ by company; each row shows its own period end date.

Source: Revenue segments as reported in each company’s SEC filings. Products are mapped to segments from company pages.
Open the Aircraft Engines search →

U.S. Bancorp (NYSE: USB) — Q3 2026 Pre Earnings

US Bancorpt NYSE USB Q3 2026 pre earnings finance note
What to watch
Commercial Lending is U.S. Bancorp's leading product

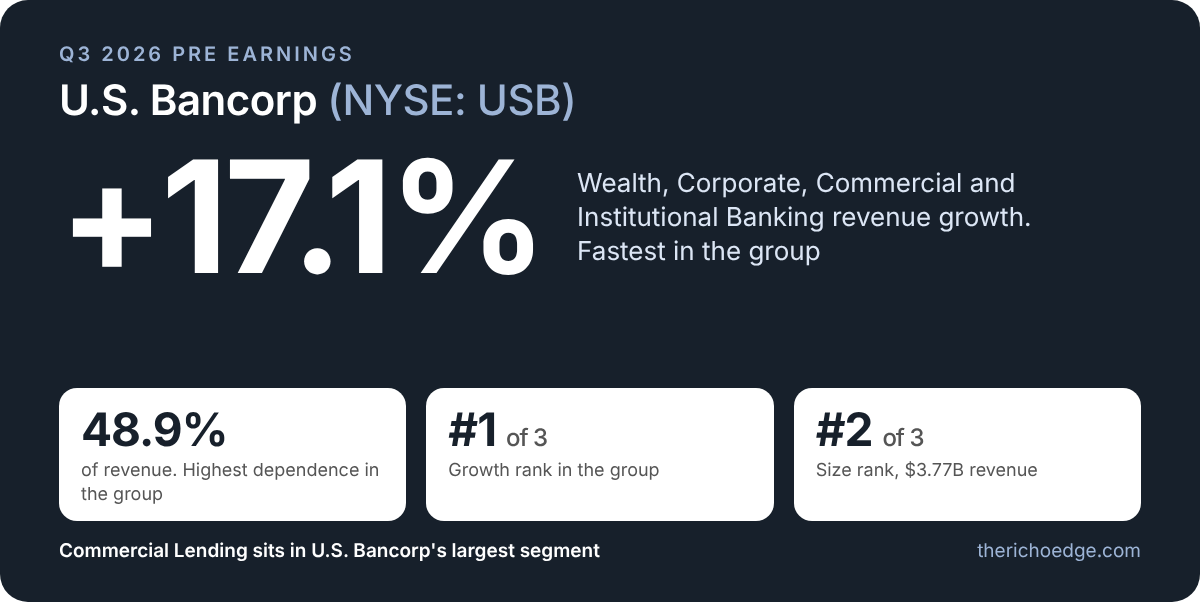
Commercial Lending sits within U.S. Bancorp’s Wealth, Corporate, Commercial and Institutional Banking segment, 48.9% of revenue before inter-segment elimination, which grew 17.1%. No other company grew faster among the three companies in the group, and U.S. Bancorp depends on it more than any peer.

See every company in Commercial Lending →
Other banks disclose similar divisions as Business Lending and Corporate Lending.
Growth rank
#1 of 3
↑ 17.1% year on year in the reported segment
Size rank
#2 of 3
$3.77B segment revenue
Share of the combined segments
28.6%
of $13.16B across 3 companies that report one
Dependence on this segment
48.9%
of USB’s total revenue

Who else sells Commercial Lending

The revenue segment each company reports that contains this product. 3 companies.

CompanyQuarterRevenue segmentSegment revenue% of companyGrowth
WFCQ2 FY2026 · Jun 30, 2026Corporate and Investment Banking$5.43B23.4%↑ 16.1%
WFCQ2 FY2026 · Jun 30, 2026Commercial Banking$3.12B13.5%↑ 6.3%
USBQ2 FY2026 · Jun 30, 2026Wealth, Corporate, Commercial and Institutional Banking$3.77B48.9%↑ 17.1%
COFQ2 FY2026 · Jun 30, 2026Commercial Banking$850M5.4%↓ 9.3%

Peer rank: year-on-year growth

Growth of the reported segment, latest quarter. A company with several segments shows its fastest.

USB
17.1%
WFC
16.1%
COF
9.3%

Concentration: share of company revenue

How much of each company’s total revenue sits in the segment above.

USB
48.9%
WFC
36.9%
COF
5.4%

Combined segment revenue

The 3 companies that report a segment for this product earned this in those segments in their latest quarters. It is the revenue of the whole reported segment, not of the product alone.

$13.16B

Coverage: Nasdaq 100 and S&P 100 companies mapped to Commercial Lending (3 companies, 3 disclose a segment). Quarters differ by company; each row shows its own period end date.

Source: Revenue segments as reported in each company’s SEC filings. Products are mapped to segments from company pages.
Open the Commercial Lending search →

Charles Schwab (NYSE: SCHW) — Q3 2026 Pre Earnings

What to watch
Wealth Management is Schwab's leading product

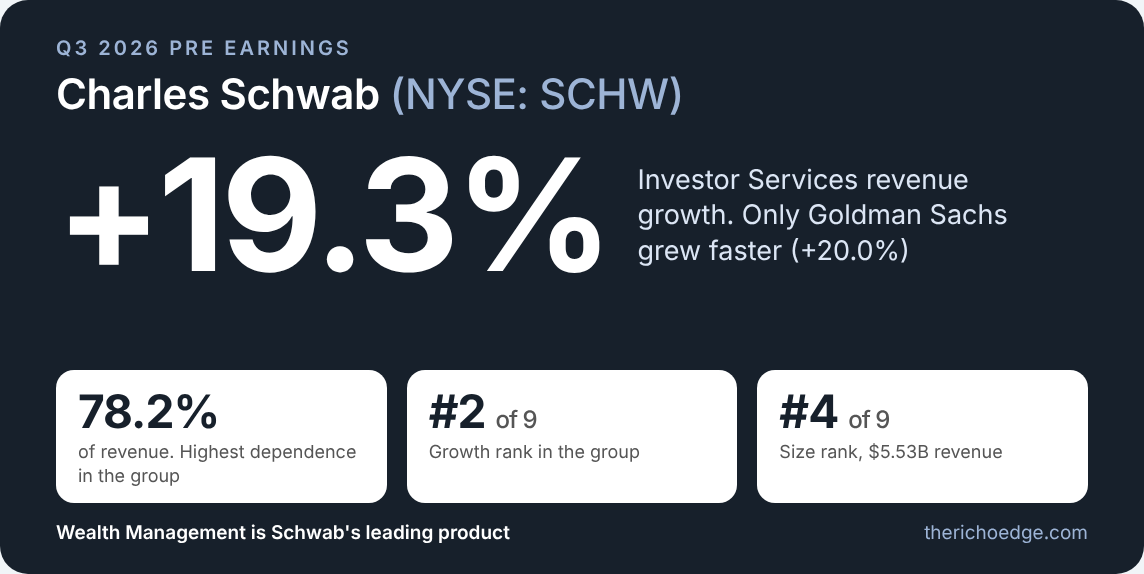
Its Investor Services segment, 78.2% of revenue, grew 19.3%, second only to Goldman Sachs’ Asset & Wealth Management (+20.0%) among the nine companies in the group, and Schwab depends on it more than any peer.

See every company in Wealth Management →
Growth rank
#2 of 9
↑ 19.3% year on year in the reported segment
Size rank
#4 of 9
$5.53B segment revenue
Share of the combined segments
8.5%
of $64.68B across 9 companies that report one
Dependence on this segment
78.2%
of SCHW’s total revenue

Who else sells Wealth Management

The revenue segment each company reports that contains this product. 9 companies.

CompanyQuarterRevenue segmentSegment revenue% of companyGrowth
JPMQ2 FY2026 · Jun 30, 2026Consumer & Community Banking$20.27B34.9%↑ 7.6%
JPMQ2 FY2026 · Jun 30, 2026Asset & Wealth Management$6.85B11.8%↑ 18.9%
MSQ2 FY2026 · Jun 30, 2026Wealth Management$8.86B41.1%↑ 14.1%
BACQ2 FY2026 · Jun 30, 2026Global Wealth & Investment Management$6.87B21.7%↑ 15.7%
SCHWQ2 FY2026 · Jun 30, 2026Investor Services$5.53B78.2%↑ 19.3%
GSQ2 FY2026 · Jun 30, 2026Asset & Wealth Management$4.60B22.6%↑ 20.0%
WFCQ2 FY2026 · Jun 30, 2026Wealth and Investment Management$3.89B16.8%↑ 13.2%
USBQ2 FY2026 · Jun 30, 2026Wealth, Corporate, Commercial and Institutional Banking$3.77B48.9%↑ 17.1%
CQ2 FY2026 · Jun 30, 2026Wealth$3.18B12.8%↑ 12.9%
BNYQ2 FY2026 · Jun 30, 2026Investment and Wealth Management$863M15.1%↑ 7.7%

Peer rank: year-on-year growth

Growth of the reported segment, latest quarter. A company with several segments shows its fastest.

GS
20.0%
SCHW
19.3%
JPM
18.9%
USB
17.1%
BAC
15.7%
MS
14.1%
WFC
13.2%
C
12.9%
BNY
7.7%

Concentration: share of company revenue

How much of each company’s total revenue sits in the segment above.

SCHW
78.2%
USB
48.9%
JPM
46.7%
MS
41.1%
GS
22.6%
BAC
21.7%
WFC
16.8%
BNY
15.1%
C
12.8%

Combined segment revenue

The 9 companies that report a segment for this product earned this in those segments in their latest quarters. It is the revenue of the whole reported segment, not of the product alone.

$64.68B

Coverage: Nasdaq 100 and S&P 100 companies mapped to Wealth Management (9 companies, 9 disclose a segment). Quarters differ by company; each row shows its own period end date.

Source: Revenue segments as reported in each company’s SEC filings. Products are mapped to segments from company pages.
Open the Wealth Management search →

Applied Digital (NASDAQ: APLD) — Q1 2027 Post Earnings

Applied Digital APLD Q1 27 Post Earnings

Operations

Q1 2027
Q1 Revenue ↑ 322.4% YoY $341.9M
Segments
Data Center Hosting 12.6%
HPC Hosting 87.4%

Key Earnings Driver

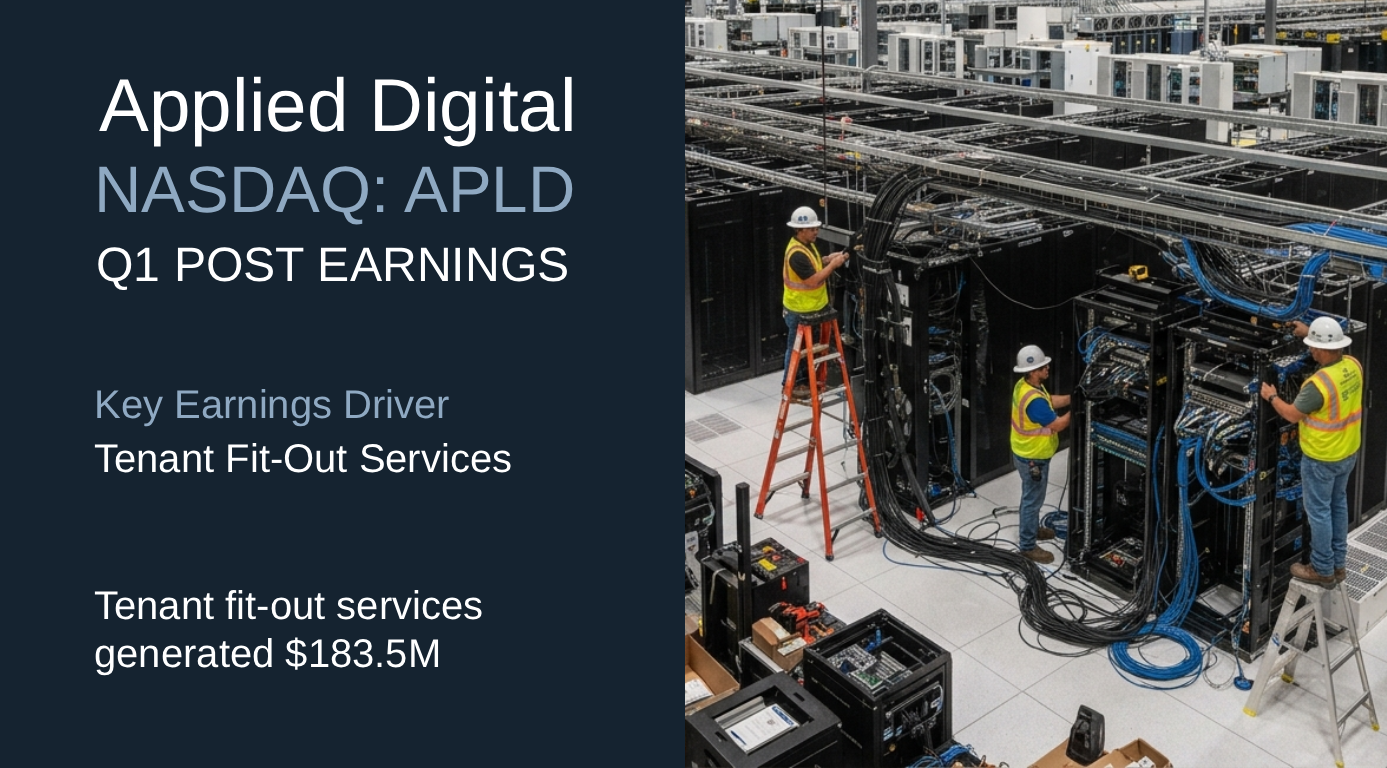
Tenant Fit-Out Services HPC Hosting revenue increased 898% year over year to $262.6M. Within HPC Hosting, tenant fit-out services generated $183.5M, an increase of approximately $157.2M. Base rent contributed $65.8M and tenant recoveries $13.3M. CEO Wes Cummins said, “Our goal is to establish Applied Digital as the category leader in the design, construction, deployment, and operation of purpose-built AI factories.”

Key Operating Metrics¹

METRIC

STATUS

Data Center Hosting↓ 0.4%

HPC Hosting↑ 898.8%

Tenant fit-out services

🟢 Scaling

Base rent

Tenant recoveries

Operations: Total Revenue is GAAP total ($341.9M). Segment % are shares of the two reportable segments ($300.4M), which exclude ChronoScale.

Key Operating Metrics¹: Core operating metrics relevant to revenue, sourced from website and/or SEC filings for Q, with status based on reported data.

Penguin Solutions (NASDAQ: PENG) — Q4 FY2026 Post Earnings

Penguin Solutions q4 26 post earnings finance note

Operations

Q4 2026
Q4 Revenue ↑ 67.7% YoY $566.7M
Segments
Advanced Computing 27.2%
Integrated Memory 60.1%
Optimized LED 12.7%

Key Earnings Driver

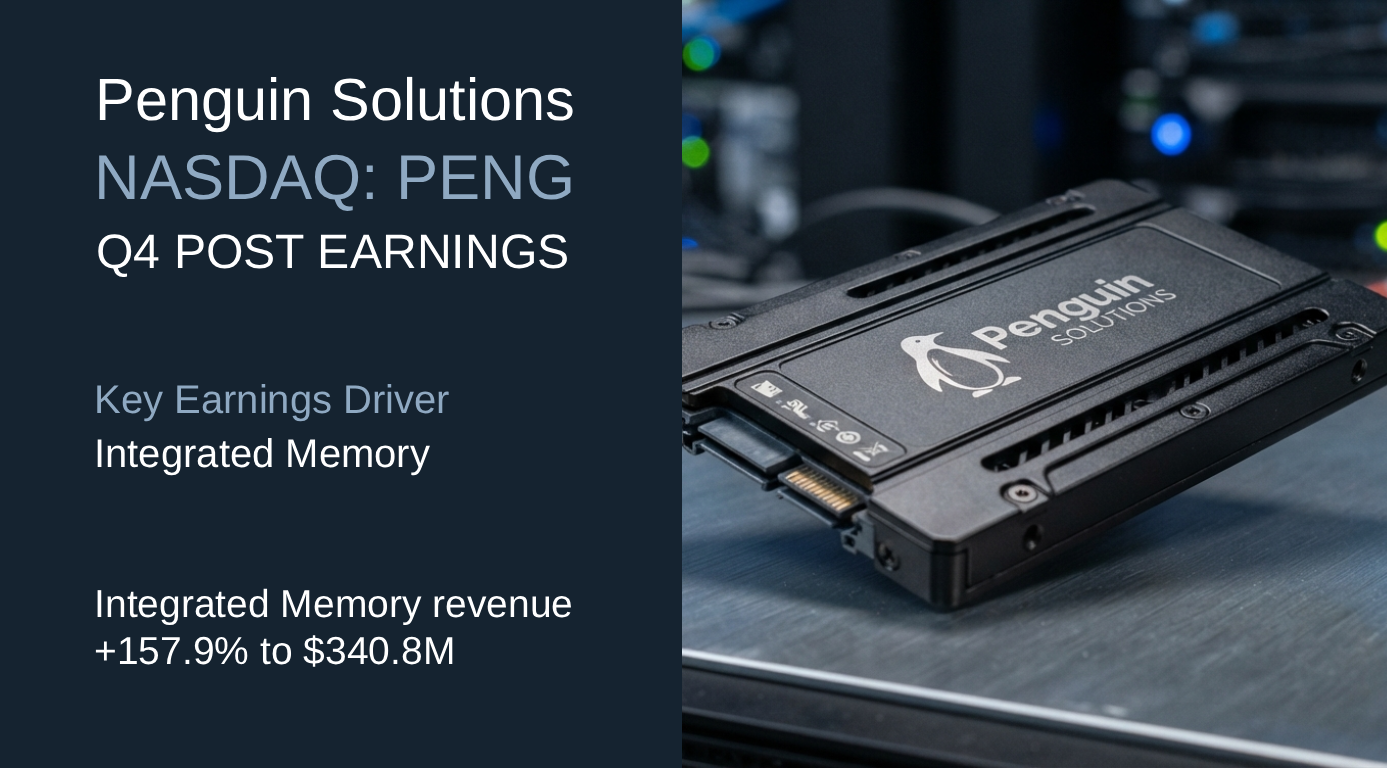
Integrated Memory Advanced Computing revenue was up 11.4% year over year to $154.0M, Integrated Memory revenue was up 157.9% to $340.8M, and Optimized LED revenue was up 6.6% to $71.9M. Management said its memory business remains strong, and its AI Infrastructure business is accelerating further.

Key Operating Metrics¹

METRIC

STATUS

Advanced Computing↑ 11.4%

Integrated Memory↑ 157.9%

🟢 Scaling

Optimized LED↑ 6.6%

Key Operating Metrics¹: Core operating metrics relevant to revenue, sourced from website and/or SEC filings for Q, with status based on reported data.

Jabil (NYSE: JBL) — Q4 2026 Post Earnings

Jabil Q4 26 post earnings

Operations

Q4 2026
Q4 Revenue ↑ 28.6% YoY $10.62B
Segments
Intelligent Infrastructure 54.7%
Regulated Industries 32.1%
Connected Living and Digital Commerce 13.2%

Key Earnings Driver

Intelligent Infrastructure Intelligent Infrastructure revenue was approximately $5.8 billion, up 56% year over year, with management stating the upside was driven by AI-related demand remaining very strong and capacity coming online sooner than planned. Regulated Industries revenue increased 9% to $3.4 billion, and Connected Living and Digital Commerce revenue was approximately $1.4 billion, roughly flat year over year.

Key Operating Metrics¹

METRIC

STATUS

Intelligent Infrastructure↑ 56.0%

🟢 Scaling

Regulated Industries↑ 9.0%

Connected Living and Digital Commerce→ 0.0%

Key Operating Metrics¹: Core operating metrics relevant to revenue, sourced from website and/or SEC filings for Q, with status based on reported data.

Micron Technology (NASDAQ: MU) — Q4 FY2026 Post Earnings

Post earnings note company quarterly analysis

Operations

Q4 2026
Q4 Revenue ↑ 379.3% YoY $54.23B
Segments
Cloud Memory Business Unit 30.0%
Core Data Center Business Unit 33.2%
Mobile and Client Business Unit 24.2%
Automotive and Embedded Business Unit 12.6%
All Other 0.0%

Key Earnings Driver

Core Data Center Business Unit Cloud Memory Business Unit revenue increased 258.4% year over year to $16.283B, Core Data Center Business Unit revenue increased 1,041.5% to $18.002B, Mobile and Client Business Unit revenue increased 248.8% to $13.114B, and Automotive and Embedded Business Unit revenue increased 375.9% to $6.824B.

Key Operating Metrics¹

METRIC

STATUS

Cloud Memory Business Unit↑ 258.4%

Core Data Center Business Unit↑ 1,041.5%

🟢 Scaling

Mobile and Client Business Unit↑ 248.8%

Automotive and Embedded Business Unit↑ 375.9%

Key Operating Metrics¹: Core operating metrics relevant to revenue, sourced from website and/or SEC filings for Q, with status based on reported data.

AAR (NYSE: AIR) — Q1 2027 Post Earnings

AAR q1 27 post earnings

Operations

Q1 2027
Q1 Revenue ↑ 24.1% YoY $918M
Segments
Parts Supply 45.2%
Repair, Engineering, and Software 32.4%
Government Solutions 15.1%
Legacy Commercial Programs 7.3%

Key Earnings Driver

Mobility Systems Parts Supply revenue increased 30.5% year over year to $414.8M, Repair, Engineering, and Software revenue increased 31.4% to $297.5M, Government Solutions revenue increased 3.7% to $138.8M and Legacy Commercial Programs revenue increased 8.8% to $66.9M. Management said Government Solutions was up 4% driven by strength in Mobility Systems.

Key Operating Metrics¹

METRIC

STATUS

Parts Supply↑ 30.5%

Repair, Engineering, and Software↑ 31.4%

Government Solutions↑ 3.7%

Government Programs↓ 5.1%

🟡 Watch

Mobility Systems↑ 47.7%

🟢 Scaling

Key Operating Metrics¹: Core operating metrics relevant to revenue, sourced from website and/or SEC filings for Q, with status based on reported data.

Concentrix (NASDAQ: CNXC) — Q3 2026 Post Earnings

Post earnings note company quarterly analysis

Operations

Q3 2026
Q3 Revenue ↓ 1.2% YoY $2.45B
Segments
Technology & Consumer Electronics 24.6%
Retail, travel and e-commerce 27.0%
Communications and media 15.6%
Banking, financial services and insurance 17.6%
Healthcare 5.9%
Other 9.3%

Key Earnings Driver

Banking, Financial Services and Insurance Technology and Consumer Electronics revenue decreased 10% year over year to $603.5M, Retail, Travel and E-Commerce revenue increased 6% to $662.6M, Communications and Media revenue decreased 7% to $381.9M, while Banking, Financial Services and Insurance revenue increased 12% to $432.5M.

Key Operating Metrics¹

METRIC

STATUS

Technology and Consumer Electronics↓ 10.0%

🟡 Watch

Retail, Travel and E–Commerce↑ 6.0%

Communications & Media↓ 7.0%

🟡 Watch

Banking, Financial Services and Insurance↑ 12.0%

🟢 Scaling

Key Operating Metrics¹: Core operating metrics relevant to revenue, sourced from website and/or SEC filings for Q, with status based on reported data.