
BlackBerry (NYSE: BB) — Q2 FY2027 Post Earnings

BlackBerry BB Q2 27 Post Earnings

Operations

Q2 2027
Q2 Revenue ↑ 26.0% YoY $163.3M
Segments
QNX 49.2%
Secure Communications 37.3%
Licensing 13.5%

Key Earnings Driver

Licensing QNX revenue increased 27.3% year over year to $80.3M. Secure Communications increased 1.7% to $60.9M, and Licensing increased 234.8% to $22.1M.

Key Operating Metrics¹

METRIC

STATUS

QNX↑ 27.3%

Secure Communications↑ 1.7%

Licensing↑ 234.8%

🟢 Scaling

Key Financial Metrics

Gross Margin 77.83% +3 pp YoY
Backlog / Revenue 612.0% 6.12x Qtr Rev
CapEx Intensity 4.35% 0.04x Revenue

Key Operating Metrics¹: Core operating metrics relevant to revenue, sourced from website and/or SEC filings for Q, with status based on reported data.
BlackBerry (NYSE: BB) — Q2 FY2027 Pre Earnings

BlackBerry BB Q2 27 pre earnings

Operations

Q1 2027
Q1 Revenue ↑ 25.6% YoY $152.9M
Segments
QNX 47.3%
Secure Communications 48.1%
Licensing 4.6%

Key Earnings Driver

Development License QNX revenue increased $14.8M or 25.7% year over year to $72.3M. Within QNX, Development License revenue increased $7.5M and Royalty revenue increased $4.2M, accounting for 50.7% and 28.4% of the QNX revenue increase respectively. QNX revenue exceeded guidance due to stronger-than-expected royalty revenue. Secure Communications increased 23.7% to $73.6M, and Licensing increased 48.9% to $7.0M.

Key Operating Metrics¹

METRIC

STATUS

QNX↑ 25.7%

Development License

🟢 Scaling

Royalty

Secure Communications↑ 23.7%

SecuSUITE

UEM

Key Financial Metrics

Gross Margin 78.29% +4.09 pp YoY
Backlog / Revenue 87.6% 0.87x Qtr Rev
CapEx Intensity 2.94% 0.02x Revenue

Key Operating Metrics¹: Core operating metrics relevant to revenue, sourced from website and/or SEC filings for Q, with status based on reported data.

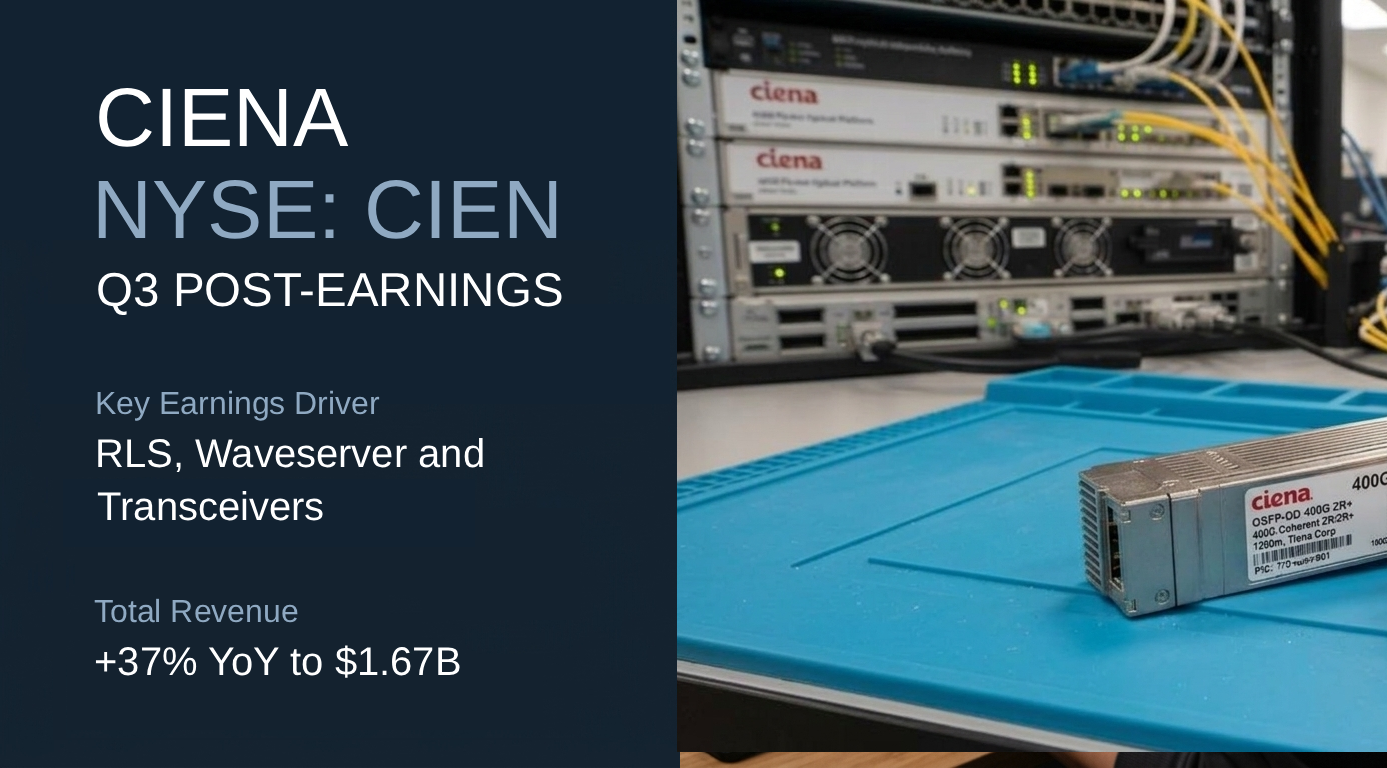
Ciena (NYSE: CIEN) — Q3 FY2026 Post Earnings

Ciena q3 26 post earnings Finance Note

Operations

Q3 2026
Q3 Revenue ↑ 37.0% YoY $1.67B
Segments
Networking Platforms 81.1%
Platform Software and Services 5.9%
Blue Planet Automation Software and Services 1.4%
Global Services 11.6%

Key Earnings Driver

RLS, Waveserver and Transceivers Networking Platforms revenue increased 44.0% year over year to $1.36B. Within Networking Platforms, Optical Networking revenue increased 46.1% to $1.19B, driven by increased sales of 6500 Reconfigurable Line Systems, Waveserver systems and coherent pluggable transceivers, and Routing and Switching revenue increased 30.6% to $164.4M. Platform Software and Services revenue increased 9.7% to $98.6M, Blue Planet Automation Software and Services revenue declined 16.5% to $23.2M, and Global Services revenue increased 20.8% to $193.6M. On the earnings call, CFO Marc Graff said RLS and Waveserver each grew more than 55%.

Key Operating Metrics¹

METRIC

STATUS

Networking Platforms↑ 44.0%

Optical Networking↑ 46.1%

6500 Reconfigurable Line Systems

🟢 Scaling

Waveserver

🟢 Scaling

Coherent pluggable transceivers

🟢 Scaling

Routing and Switching↑ 30.6%

Global Services↑ 20.8%

Maintenance, Support, and Learning↑ 11.3%

Implementation↑ 33.4%

Advisory and Enablement↑ 16.3%

Key Financial Metrics

Gross Margin 45.40% +4.1 pp YoY
Backlog / Revenue 508.6% 5.08x Qtr Rev
CapEx Intensity N/A

Key Operating Metrics¹: Core operating metrics relevant to revenue, sourced from website and/or SEC filings for Q, with status based on reported data.