
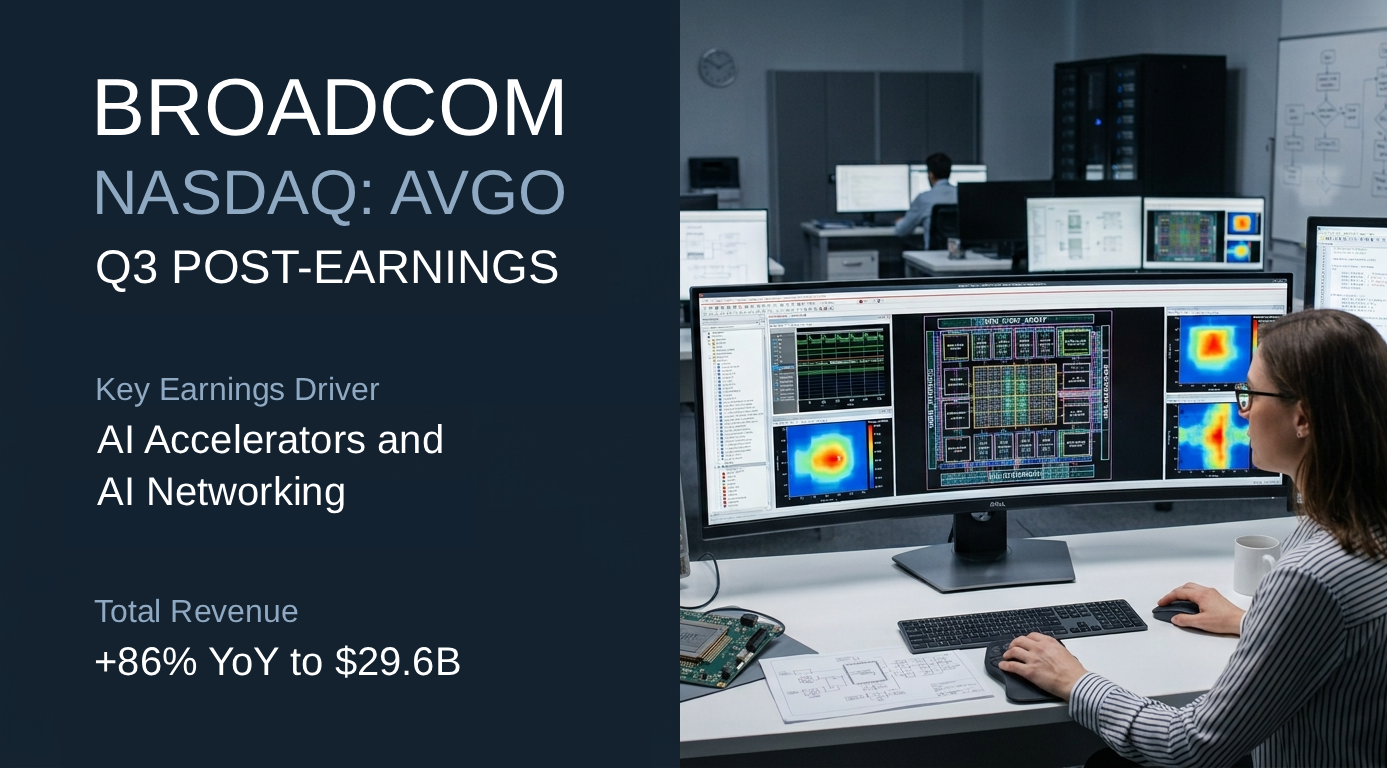
Broadcom (NASDAQ: AVGO) — Q3 FY2026 Post Earnings

Broadcom avgo q3 26 post earnings

Operations

Q3 2026
Q3 Revenue ↑ 85.5% YoY $29.59B
Segments
Semiconductor Solutions 70.4%
Infrastructure Software 29.6%

Key Earnings Driver

AI Accelerators and AI Networking Semiconductor Solutions revenue increased 127.4 year over year to $20.8B. Within Semiconductor Solutions, AI semiconductor revenue increased 221.0% to $16.7B, driven by strong demand for custom AI accelerators and AI networking. Infrastructure Software revenue increased 29.0% to $8.8B. Management expects AI semiconductor revenue to reach $21.7B in Q4.

Key Operating Metrics¹

METRIC

STATUS

Semiconductor Solutions↑ 127.4%

AI semiconductor↑ 221.0%

AI Accelerators

🟢 Scaling

AI Networking

🟢 Scaling

Non-AI Semiconductor

Infrastructure Software↑ 29.0%

Key Financial Metrics

Gross Margin 69.13% +2.04 pp YoY
Backlog / Revenue N/A
CapEx Intensity 1.80% 0.01x Revenue

Key Operating Metrics¹: Core operating metrics relevant to revenue, sourced from website and/or SEC filings for Q, with status based on reported data.
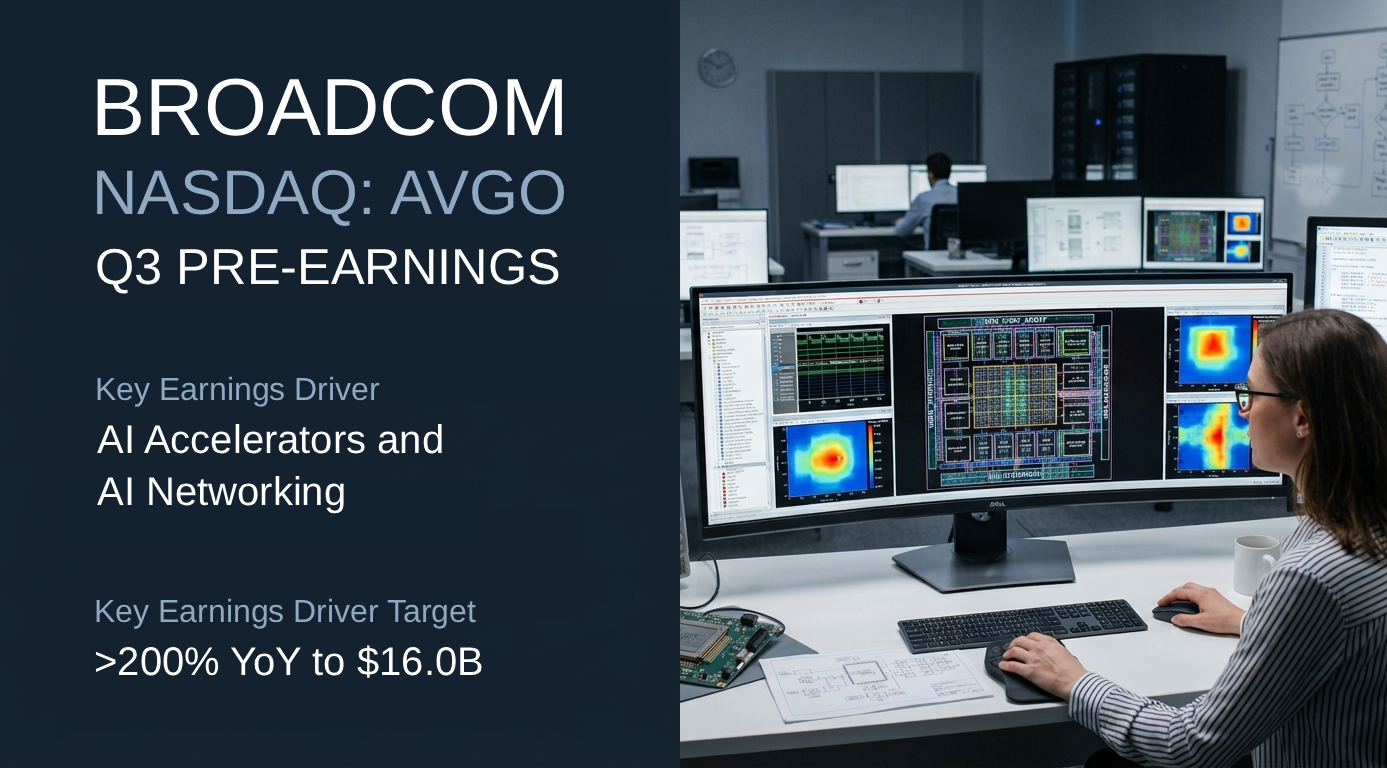

Broadcom (NASDAQ: AVGO) — Q3 FY2026 Pre Earnings

Broadcom avgo q3 26 pre earnings finance note

Operations

Q2 2026
Q2 Revenue ↑ 47.9% YoY $22.19B
Segments
Semiconductor Solutions 67.6%
Infrastructure Software 32.4%

Key Earnings Driver

AI Accelerators and AI Networking Semiconductor Solutions revenue increased 78.5% year over year to $15.0B. Within Semiconductor Solutions, AI semiconductor revenue increased 143.0% to $10.8B, driven by increasing demand for custom AI Accelerators and AI Networking. Infrastructure Software revenue increased 8.8% to $7.2B, primarily driven by VMware Cloud Foundation. For Q3, Hock Tan, President and CEO of Broadcom, expects semiconductor revenue from AI to grow more than 200% year over year to $16.0B.

Key Operating Metrics¹

METRIC

STATUS

Semiconductor Solutions↑ 78.5%

AI semiconductor↑ 143.0%

AI Accelerators

🟢 Scaling

AI Networking

🟢 Scaling

Infrastructure Software↑ 8.8%

VMware Cloud Foundation

Key Financial Metrics

Gross Margin 69.47% +1.51 pp YoY
Backlog / Revenue N/A
CapEx Intensity 1.04% 0.01x Revenue

Key Operating Metrics¹: Core operating metrics relevant to revenue, sourced from website and/or SEC filings for Q, with status based on reported data.

Salesforce (NYSE: CRM) — Q2 FY2027 Post Earnings

Post earnings note company quarterly analysis

Operations

Q2 2027
Q2 Revenue ↑ 10.8% YoY $11.35B
Segments
Subscription and support 95.4%
Professional services and other 4.6%

Key Earnings Driver

Data 360, Headless Platform, and Other Subscription and support revenue increased 11.7% year over year to $10.820B. Within Subscription and support, Agentforce Apps revenue increased 7.6% to $7.193B, Data 360, Headless Platform and Other revenue increased 20.3% to $3.618B. Professional services and other declined -3.8% to $525M. Management cited strong momentum in Agentforce Apps and Data 360, bolstered by the acquisition of Informatica.

Key Operating Metrics¹

METRIC

STATUS

Subscription and support↑ 11.7%

Agentforce Apps↑ 7.6%

Data 360, Headless Platform, and Other↑ 20.3%

🟢 Scaling

Key Financial Metrics

Gross Margin 76.65% -1.4 pp YoY
Backlog / Revenue 295.3% 2.95x Qtr Rev
CapEx Intensity 1.51% 0.01x Revenue

Key Operating Metrics¹: Core operating metrics relevant to revenue, sourced from website and/or SEC filings for Q, with status based on reported data.