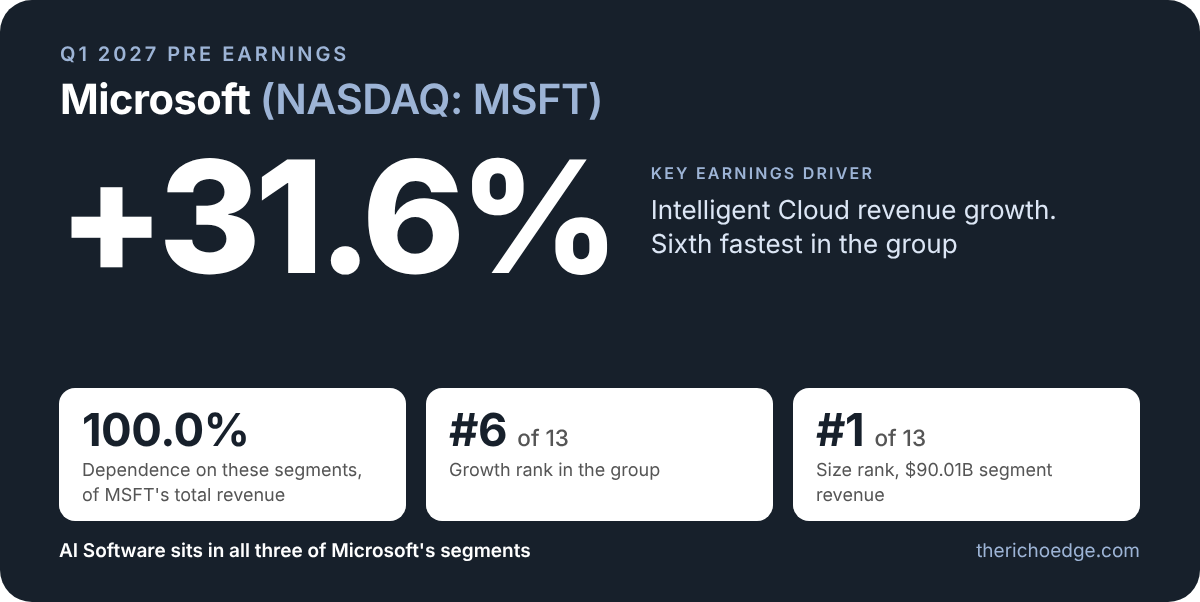
AI Software sits within Microsoft’s “Productivity and Business Processes”, “Intelligent Cloud” and “More Personal Computing” segments. The segments make up 100.0% of Microsoft’s revenue. Intelligent Cloud grew 31.6% and is Microsoft’s Key Earnings Driver. Nvidia’s Data Center segment grew fastest in the group at 116.6%.
Microsoft’s segments total $90.01B, the largest of the 13 companies, just ahead of Nvidia’s $89.02B, and represent 33.7% of their combined segment revenue. Productivity and Business Processes grew 14.3% and More Personal Computing fell 4.4%.
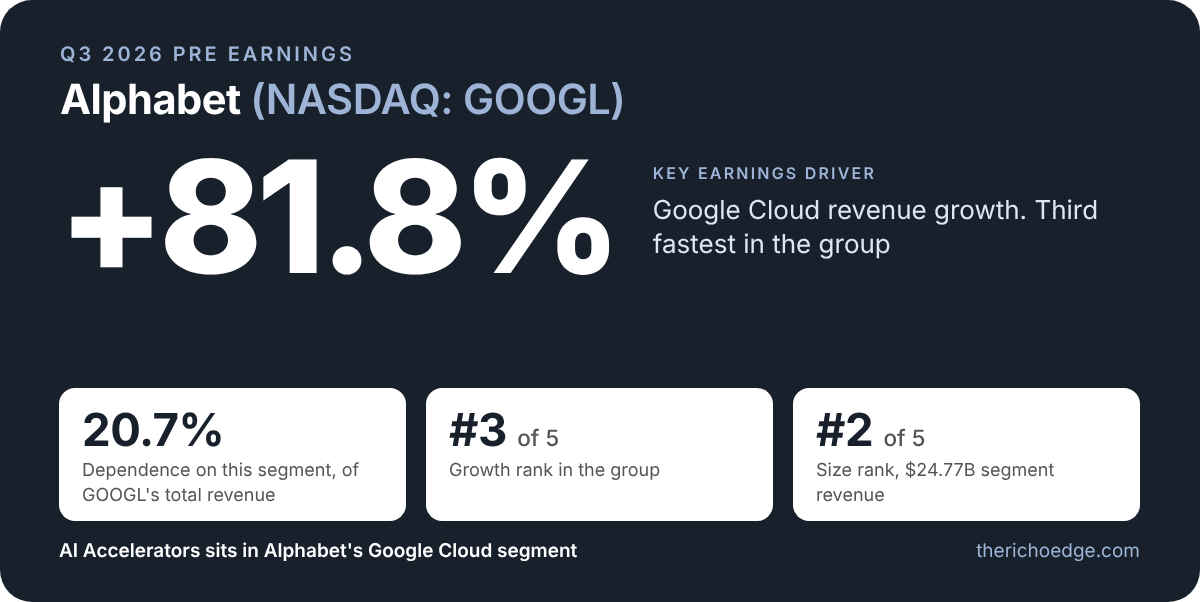
AI Accelerators sits within Alphabet’s Google Cloud segment, which makes up 20.7% of Alphabet’s revenue. Google Cloud grew 81.8% and is Alphabet’s Key Earnings Driver. AMD’s Data Center segment grew fastest in the group at 107.3%.
Alphabet’s Google Cloud segment totals $24.77B, the second largest of the five companies behind Nvidia’s $48.71B, and represents 29.6% of their combined segment revenue.
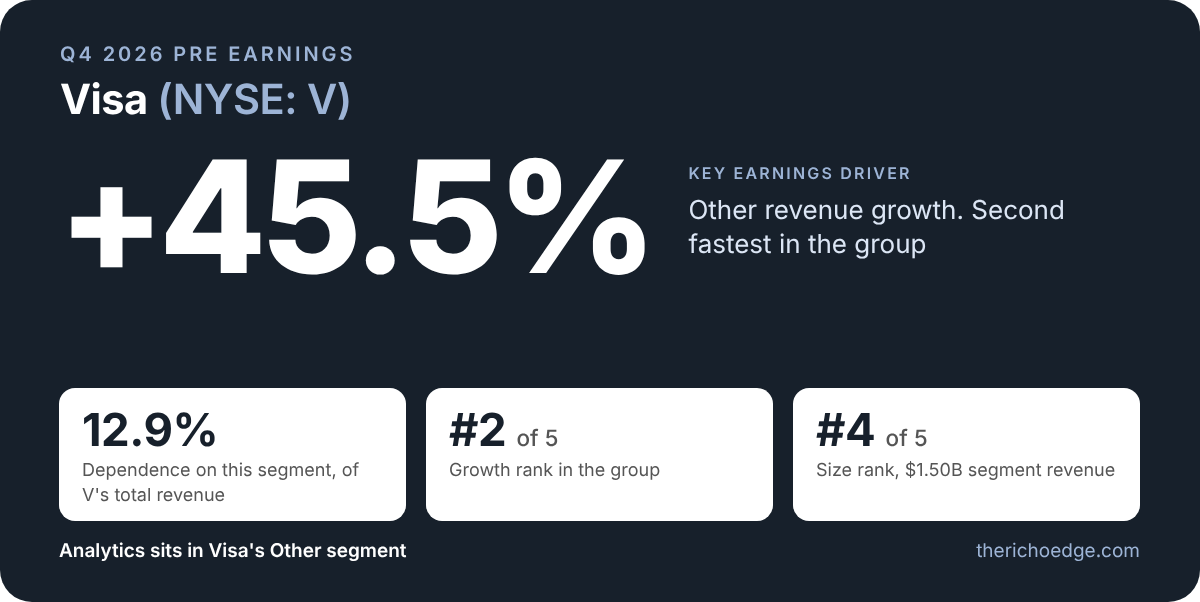
Analytics sits within Visa’s Other segment, which makes up 12.9% of Visa’s revenue. Other grew 45.5% and is Visa’s Key Earnings Driver. Oracle’s Cloud infrastructure segment grew fastest in the group at 120.7%.
Visa’s segment totals $1.50B, the fourth largest of the five companies, and represents 8.1% of their combined segment revenue. Oracle’s is the largest, at $7.39B.
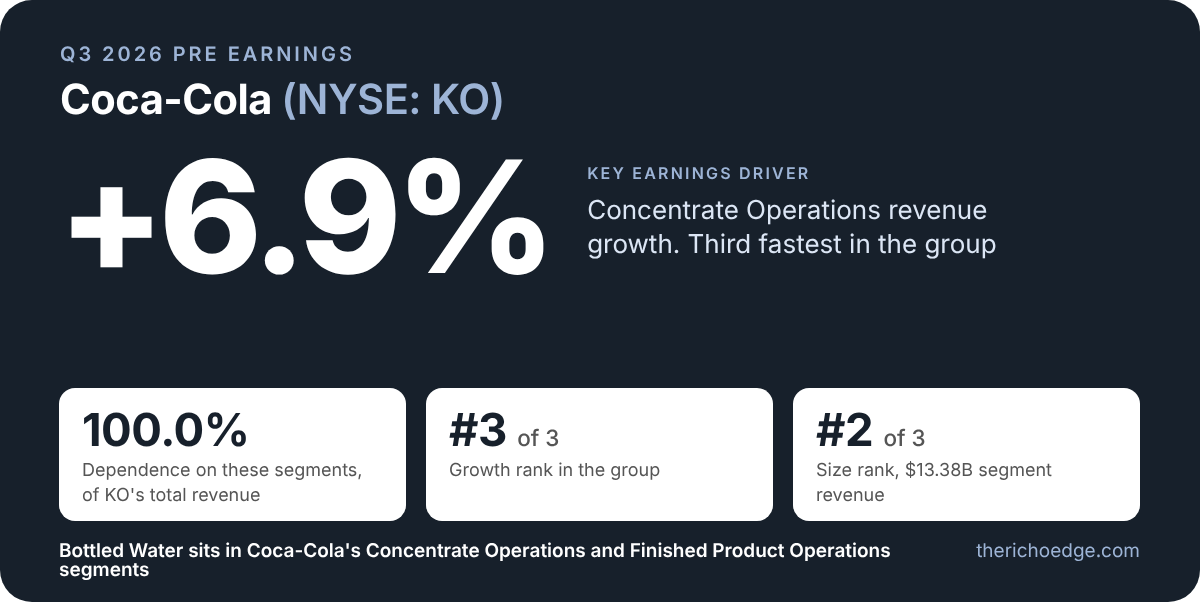
Bottled Water sits within Coca-Cola’s “Concentrate Operations” and “Finished Product Operations” segments. The segments make up 100.0% of Coca-Cola’s revenue. Concentrate Operations grew 6.9% and is Coca-Cola’s Key Earnings Driver. Keurig Dr Pepper’s KDP International segment grew fastest in the group at 25.9%.
Coca-Cola’s segments total $13.38B, the second largest of the three companies reporting in US dollars behind PepsiCo’s $14.52B, and represent 42.8% of their combined segment revenue. Finished Product Operations grew 6.4%.
How does the company compare with its competitors?
6 companies sell Bottled Water
CCEP
KDP
KO
MNST
PEP
SBUX
Growth rank
#3 of 3
↑ 6.9% year on year in the reported segment
Size rank
#2 of 3
$13.38B segment revenue
Share of the combined segments
42.8%
of $31.24B across 3 companies that report one
Dependence on these segments
100.0%
of KO’s total revenue
MNST and SBUX do not report segment revenue for Bottled Water. CCEP reports in EUR; only companies reporting in USD are ranked. Coverage: Nasdaq 100 and S&P 100.
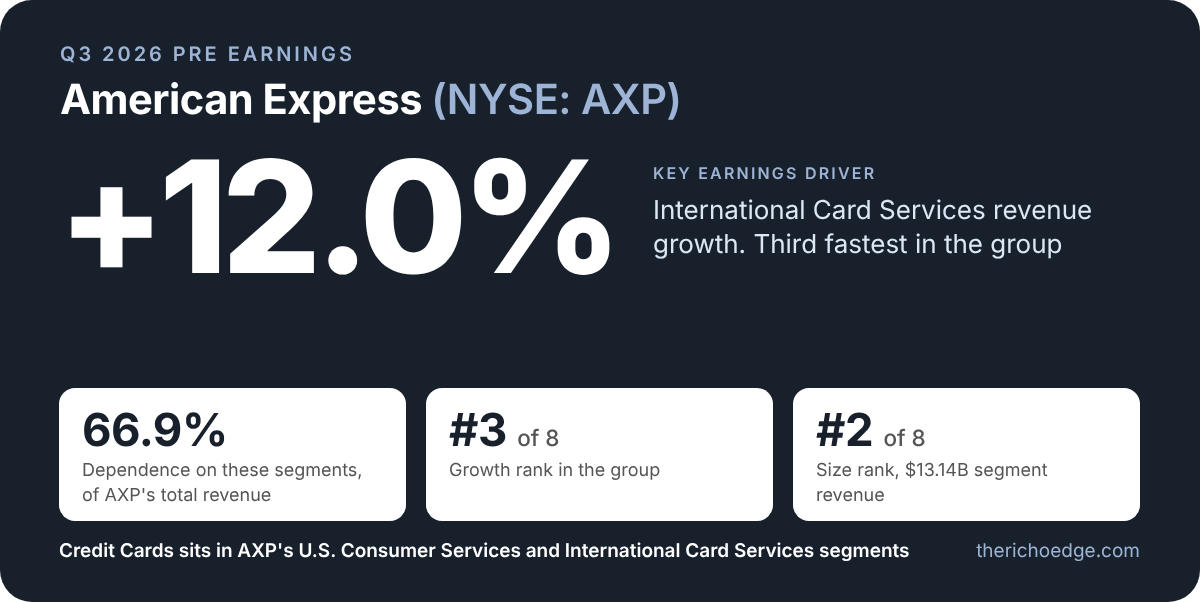
Credit Cards sits within American Express’s U.S. Consumer Services and International Card Services segments. The segments make up 66.9% of American Express’s revenue. International Card Services grew 12.0% and is American Express’s Key Earnings Driver. Capital One grew fastest in the group at 29.4%.
The revenue segment each company reports that contains this product. 8 companies.
Company
Quarter
Revenue segment
Segment revenue
% of company
Growth
JPM
Q2 FY2026 · Jun 30, 2026
Consumer & Community Banking
$20.27B
34.9%
↑ 7.6%
AXP
Q2 FY2026 · Jun 30, 2026
U.S. Consumer Services
$9.52B
48.5%
↑ 11.4%
AXP
Q2 FY2026 · Jun 30, 2026
International Card Services
$3.62B
18.4%
↑ 12.0%
COF
Q2 FY2026 · Jun 30, 2026
Credit Card
$11.77B
74.2%
↑ 29.4%
BAC
Q2 FY2026 · Jun 30, 2026
Consumer Banking
$11.34B
35.7%
↑ 4.8%
WFC
Q2 FY2026 · Jun 30, 2026
Consumer Banking and Lending
$10.29B
44.5%
↑ 6.2%
C
Q2 FY2026 · Jun 30, 2026
U.S. Consumer Cards
$4.52B
18.3%
↑ 1.1%
C
Q2 FY2026 · Jun 30, 2026
All Other
$1.76B
7.1%
↑ 14.2%
USB
Q2 FY2026 · Jun 30, 2026
Payment Services
$1.81B
23.5%
↑ 5.7%
GS
Q2 FY2026 · Jun 30, 2026
Platform Solutions
$221M
1.1%
↓ 64.3%
Peer rank: year-on-year growth
Growth of the reported segment, latest quarter. A company with several segments shows its fastest.
COF
29.4%
C
14.2%
AXP
12.0%
JPM
7.6%
WFC
6.2%
USB
5.7%
BAC
4.8%
GS
64.3%
Concentration: share of company revenue
How much of each company’s total revenue sits in the segment above.
COF
74.2%
AXP
66.9%
WFC
44.5%
BAC
35.7%
JPM
34.9%
C
25.3%
USB
23.5%
GS
1.1%
Combined segment revenue
The 8 companies that report a segment for this product earned this in those segments in their latest quarters. It is the revenue of the whole reported segment, not of the product alone.
$75.12B
Coverage: Nasdaq 100 and S&P 100 companies mapped to Credit Cards (8 companies, 8 disclose a segment). Quarters differ by company; each row shows its own period end date.
Source: Revenue segments as reported in each company’s SEC filings. Products are mapped to segments from company pages.
Hard Disk Drives is a Key Product of Western Digital
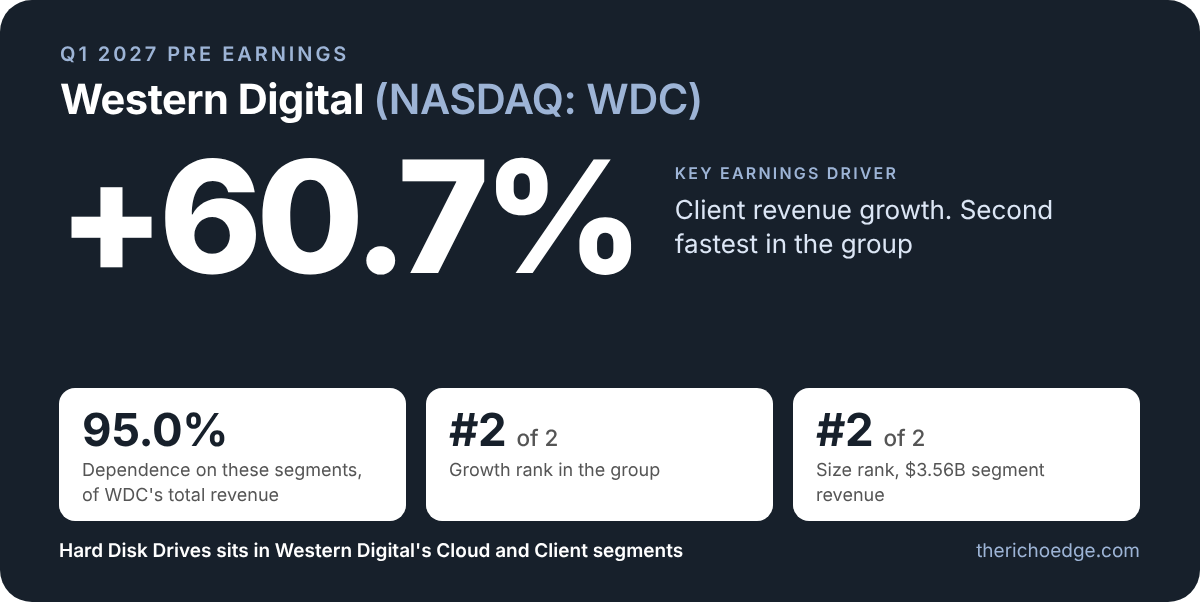
Hard Disk Drives sits within Western Digital’s Cloud and Client segments. The segments make up 95.0% of Western Digital’s revenue. Client grew 60.7% and is Western Digital’s Key Earnings Driver. Seagate grew fastest at 112.6%.
The revenue segment each company reports that contains this product. 2 companies.
Company
Quarter
Revenue segment
Segment revenue
% of company
Growth
STX
Q4 FY2026 · Jul 3, 2026
OEMs
$2.87B
79.0%
↑ 44.7%
STX
Q4 FY2026 · Jul 3, 2026
Distributors
$572M
15.8%
↑ 112.6%
STX
Q4 FY2026 · Jul 3, 2026
Retailers
$191M
5.3%
↓ 1.5%
WDC
Q4 FY2026 · Jul 3, 2026
Cloud
$3.34B
89.0%
↑ 43.2%
WDC
Q4 FY2026 · Jul 3, 2026
Client
$225M
6.0%
↑ 60.7%
Peer rank: year-on-year growth
Growth of the reported segment, latest quarter. A company with several segments shows its fastest.
STX
112.6%
WDC
60.7%
Concentration: share of company revenue
How much of each company’s total revenue sits in the segment above.
STX
100.0%
WDC
95.0%
Combined segment revenue
The 2 companies that report a segment for this product earned this in those segments in their latest quarters. It is the revenue of the whole reported segment, not of the product alone.
$7.19B
Coverage: Nasdaq 100 and S&P 100 companies mapped to Hard Disk Drives (2 companies, 2 disclose a segment). Quarters differ by company; each row shows its own period end date.
Source: Revenue segments as reported in each company’s SEC filings. Products are mapped to segments from company pages.
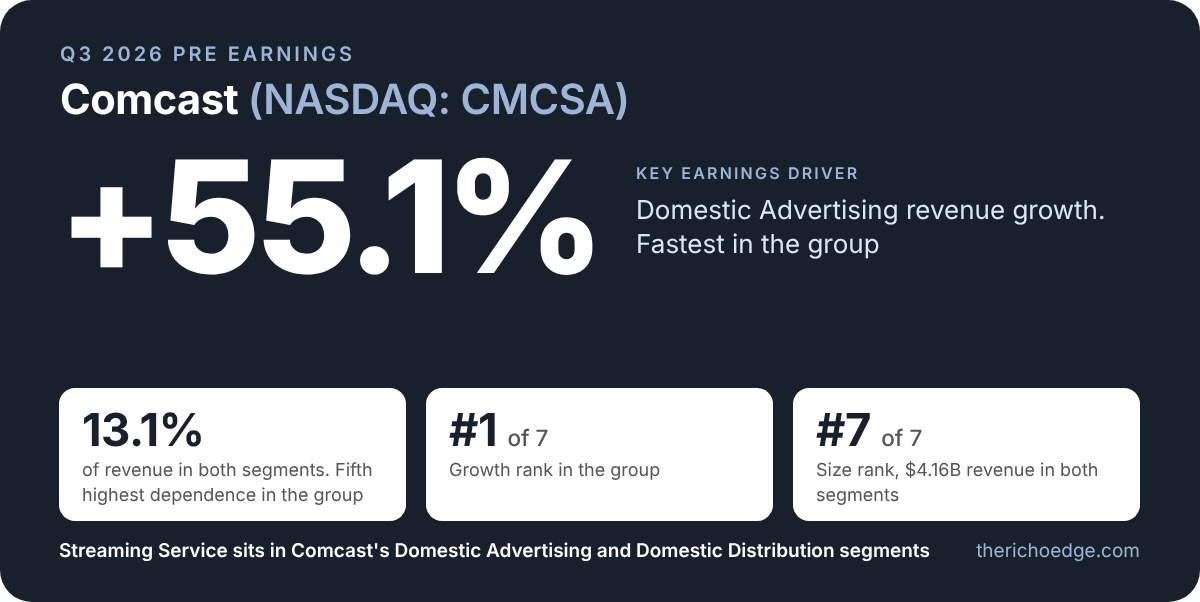
Streaming Service sits within Comcast’s Domestic Advertising and Domestic Distribution segments. The segments make up 13.1% of Comcast’s revenue. Domestic Advertising grew 55.1%, the fastest in the group, and is Comcast’s Key Earnings Driver.
The revenue segment each company reports that contains this product. 7 companies.
Company
Quarter
Revenue segment
Segment revenue
% of company
Growth
AAPL
Q3 FY2026 · Jun 27, 2026
Services
$30.74B
28.1%
↑ 12.1%
AMZN
Q2 FY2026 · Jun 30, 2026
Subscription Services
$13.73B
6.8%
↑ 12.5%
DIS
Q3 FY2026 · Jun 27, 2026
Subscription and Affiliate Fees
$7.55B
29.2%
↑ 11.5%
DIS
Q3 FY2026 · Jun 27, 2026
Subscription and Affiliate Fees
$3.14B
12.2%
↑ 8.4%
DIS
Q3 FY2026 · Jun 27, 2026
Advertising
$1.63B
6.3%
↓ 1.0%
DIS
Q3 FY2026 · Jun 27, 2026
Advertising
$1.20B
4.7%
↑ 4.9%
GOOGL
Q2 FY2026 · Jun 30, 2026
Google Subscriptions, Platforms and Devices
$12.91B
10.8%
↑ 15.2%
NFLX
Q2 FY2026 · Jun 30, 2026
Total Revenue
$12.56B
100.0%
↑ 13.4%
MELI
Q2 FY2026 · Jun 30, 2026
Commerce Services
$4.30B
42.3%
↑ 42.0%
CMCSA
Q2 FY2026 · Jun 30, 2026
Domestic Advertising
$2.16B
6.8%
↑ 55.1%
CMCSA
Q2 FY2026 · Jun 30, 2026
Domestic Distribution
$1.99B
6.3%
↑ 22.1%
Peer rank: year-on-year growth
Growth of the reported segment, latest quarter. A company with several segments shows its fastest.
CMCSA
55.1%
MELI
42.0%
GOOGL
15.2%
NFLX
13.4%
AMZN
12.5%
AAPL
12.1%
DIS
11.5%
Concentration: share of company revenue
How much of each company’s total revenue sits in the segment above.
NFLX
100.0%
DIS
52.4%
MELI
42.3%
AAPL
28.1%
CMCSA
13.1%
GOOGL
10.8%
AMZN
6.8%
Combined segment revenue
The 7 companies that report a segment for this product earned this in those segments in their latest quarters. It is the revenue of the whole reported segment, not of the product alone.
$91.91B
Coverage: Nasdaq 100 and S&P 100 companies mapped to Streaming Service (7 companies, 7 disclose a segment). Quarters differ by company; each row shows its own period end date.
Source: Revenue segments as reported in each company’s SEC filings. Products are mapped to segments from company pages.
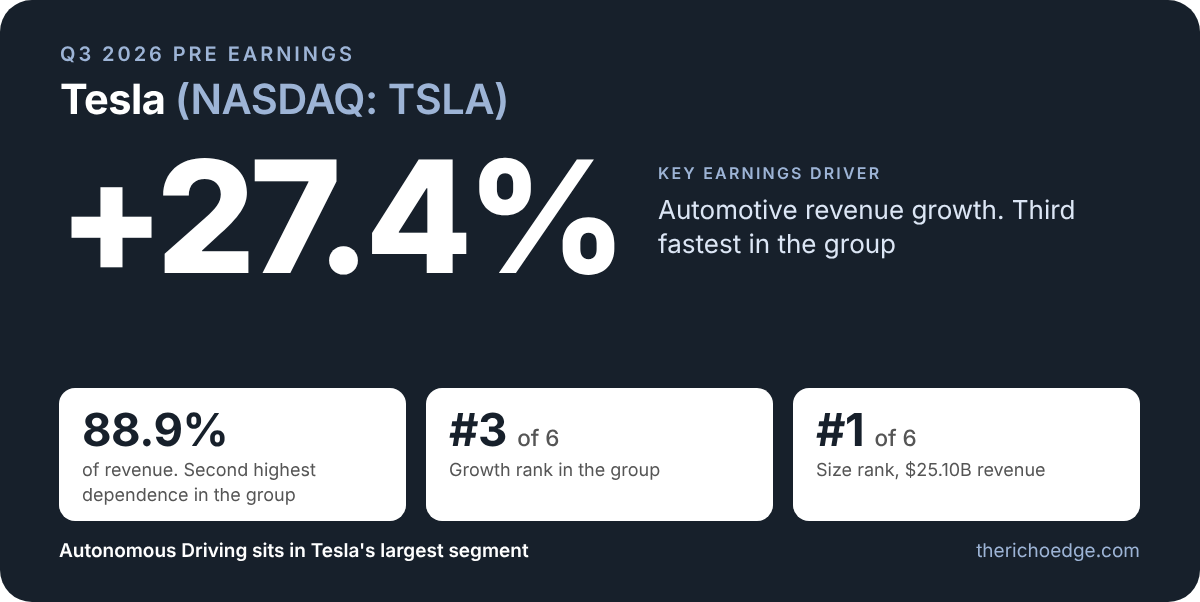
Autonomous Driving sits alongside Electric Vehicles, EV Charging and Auto Insurance within Tesla’s Automotive segment. The segment is 88.9% of revenue, grew 27.4%, and is the largest in the group, almost 16 times Qualcomm’s. Nebius grew fastest at 400.0%.
The revenue segment each company reports that contains this product. 6 companies.
Company
Quarter
Revenue segment
Segment revenue
% of company
Growth
TSLA
Q2 FY2026 · Jun 30, 2026
Automotive
$25.10B
88.9%
↑ 27.4%
QCOM
Q3 FY2026 · Jun 28, 2026
Automotive
$1.59B
16.0%
↑ 61.4%
ARM
Q1 FY2027 · Jun 30, 2026
Royalty
$715M
55.5%
↑ 22.2%
ARM
Q1 FY2027 · Jun 30, 2026
License and Other
$574M
44.5%
↑ 22.6%
INTC
Q2 FY2026 · Jun 27, 2026
All Other
$701M
3.2%
↓ 33.4%
GOOGL
Q2 FY2026 · Jun 30, 2026
Other Bets
$382M
0.3%
↑ 2.4%
NBIS
Q2 FY2026 · Jun 30, 2026
Avride
$1.0M
0.2%
↑ 400.0%
Peer rank: year-on-year growth
Growth of the reported segment, latest quarter. A company with several segments shows its fastest.
NBIS
400.0%
QCOM
61.4%
TSLA
27.4%
ARM
22.6%
GOOGL
2.4%
INTC
33.4%
Concentration: share of company revenue
How much of each company’s total revenue sits in the segment above.
ARM
100.0%
TSLA
88.9%
QCOM
16.0%
INTC
3.2%
GOOGL
0.3%
NBIS
0.2%
Combined segment revenue
The 6 companies that report a segment for this product earned this in those segments in their latest quarters. It is the revenue of the whole reported segment, not of the product alone.
$29.06B
Coverage: Nasdaq 100 and S&P 100 companies mapped to Autonomous Driving (6 companies, 6 disclose a segment). Quarters differ by company; each row shows its own period end date.
Source: Revenue segments as reported in each company’s SEC filings. Products are mapped to segments from company pages.
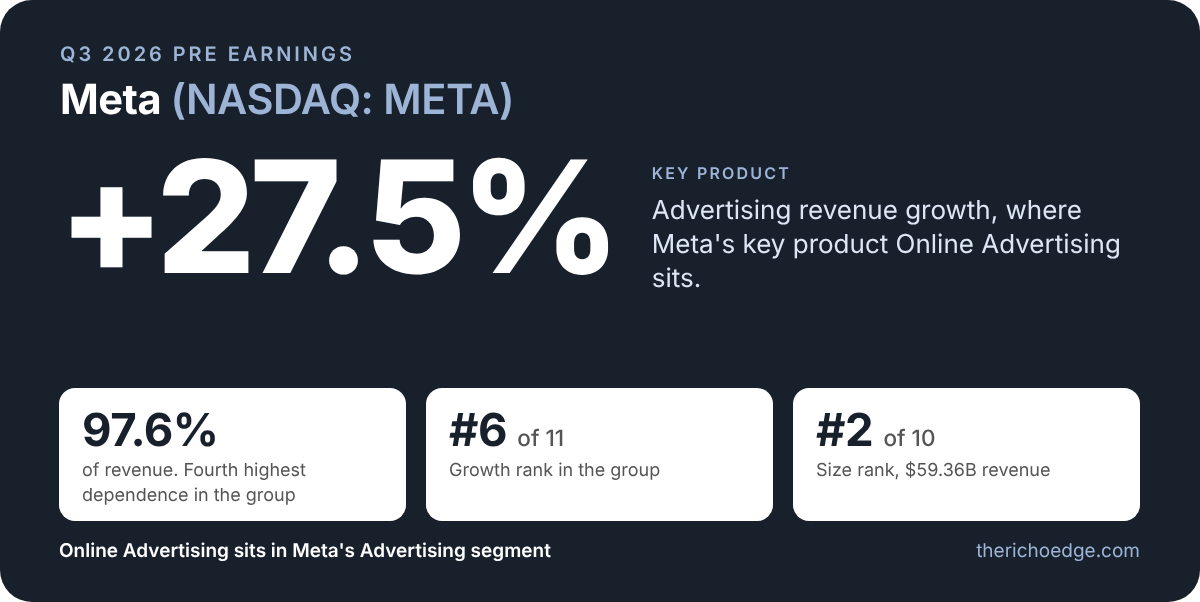
Online Advertising sits within Meta’s Advertising segment, 97.6% of revenue, which grew 27.5%, almost twice as fast as Alphabet’s, the only larger segment in the group. AppLovin grew fastest at 52.8%.
The revenue segment each company reports that contains this product. 14 companies; 3 do not disclose a segment.
Company
Quarter
Revenue segment
Segment revenue
% of company
Growth
GOOGL
Q2 FY2026 · Jun 30, 2026
Google Advertising
$81.63B
68.1%
↑ 14.4%
META
Q2 FY2026 · Jun 30, 2026
Advertising
$59.36B
97.6%
↑ 27.5%
AMZN
Q2 FY2026 · Jun 30, 2026
Advertising Services
$19.81B
9.9%
↑ 26.2%
UBER
Q2 FY2026 · Jun 30, 2026
Mobility
$7.36B
51.9%
↑ 1.0%
UBER
Q2 FY2026 · Jun 30, 2026
Delivery
$5.25B
37.0%
↑ 27.9%
NFLX
Q2 FY2026 · Jun 30, 2026
Total Revenue
$12.56B
100.0%
↑ 13.4%
DASH
Q2 FY2026 · Jun 30, 2026
Total Revenue
$4.45B
100.0%
↑ 35.6%
MELI
Q2 FY2026 · Jun 30, 2026
Commerce Services
$4.30B
42.3%
↑ 42.0%
SHOP
Q2 FY2026 · Jun 30, 2026
Merchant Solutions
$2.78B
77.6%
↑ 37.4%
APP
Q2 FY2026 · Jun 30, 2026
Total Revenue
$1.92B
100.0%
↑ 52.8%
BKNG
Q2 FY2026 · Jun 30, 2026
Advertising and Other
$322M
4.4%
↑ 8.4%
PDD
Q2 FY2026 · Jun 30, 2026
Online Marketing Services and Others
RMB 57.64B
51.3%
↑ 3.5%
ADBE
Q3 FY2026 · Aug 28, 2026
Not disclosed by ADBE
PYPL
Q2 FY2026 · Jun 30, 2026
Not disclosed by PYPL
TTWO
Q1 FY2027 · Jun 30, 2026
Not disclosed by TTWO
Peer rank: year-on-year growth
Growth of the reported segment, latest quarter. A company with several segments shows its fastest.
APP
52.8%
MELI
42.0%
SHOP
37.4%
DASH
35.6%
UBER
27.9%
META
27.5%
AMZN
26.2%
GOOGL
14.4%
NFLX
13.4%
BKNG
8.4%
PDD
3.5%
Concentration: share of company revenue
How much of each company’s total revenue sits in the segment above.
NFLX
100.0%
APP
100.0%
DASH
100.0%
META
97.6%
UBER
88.8%
SHOP
77.6%
GOOGL
68.1%
PDD
51.3%
MELI
42.3%
AMZN
9.9%
BKNG
4.4%
Combined segment revenue
The 10 companies that report a segment for this product earned this in those segments in their latest quarters. It is the revenue of the whole reported segment, not of the product alone. 1 company reporting in another currency is left out of the total and the size rank.
$199.75B
Coverage: Nasdaq 100 and S&P 100 companies mapped to Online Advertising (14 companies, 11 disclose a segment). Quarters differ by company; each row shows its own period end date.
Source: Revenue segments as reported in each company’s SEC filings. Products are mapped to segments from company pages.
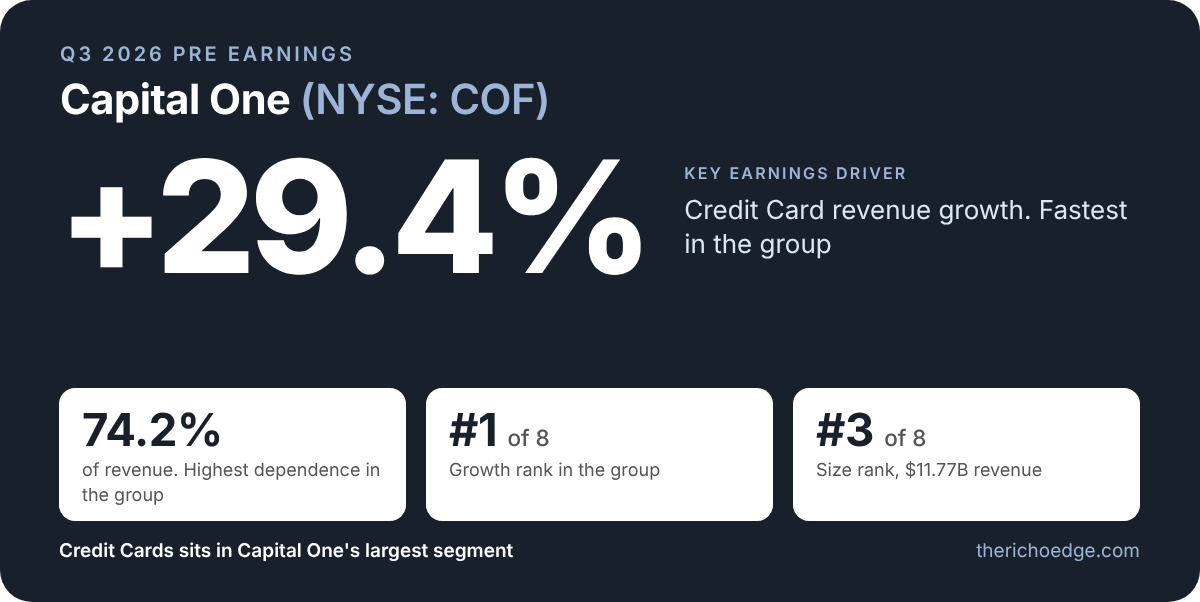
Credit Cards sits within Capital One’s Credit Card segment, 74.2% of revenue, which grew 29.4%. No other company grew faster among the eight companies in the group, and Capital One depends on it more than any peer.
The revenue segment each company reports that contains this product. 8 companies.
Company
Quarter
Revenue segment
Segment revenue
% of company
Growth
JPM
Q2 FY2026 · Jun 30, 2026
Consumer & Community Banking
$20.27B
34.9%
↑ 7.6%
AXP
Q2 FY2026 · Jun 30, 2026
U.S. Consumer Services
$9.52B
48.5%
↑ 11.4%
AXP
Q2 FY2026 · Jun 30, 2026
International Card Services
$3.62B
18.4%
↑ 12.0%
COF
Q2 FY2026 · Jun 30, 2026
Credit Card
$11.77B
74.2%
↑ 29.4%
BAC
Q2 FY2026 · Jun 30, 2026
Consumer Banking
$11.34B
35.7%
↑ 4.8%
WFC
Q2 FY2026 · Jun 30, 2026
Consumer Banking and Lending
$10.29B
44.5%
↑ 6.2%
C
Q2 FY2026 · Jun 30, 2026
U.S. Consumer Cards
$4.52B
18.3%
↑ 1.1%
C
Q2 FY2026 · Jun 30, 2026
All Other
$1.76B
7.1%
↑ 14.2%
USB
Q2 FY2026 · Jun 30, 2026
Payment Services
$1.81B
23.5%
↑ 5.7%
GS
Q2 FY2026 · Jun 30, 2026
Platform Solutions
$221M
1.1%
↓ 64.3%
Peer rank: year-on-year growth
Growth of the reported segment, latest quarter. A company with several segments shows its fastest.
COF
29.4%
C
14.2%
AXP
12.0%
JPM
7.6%
WFC
6.2%
USB
5.7%
BAC
4.8%
GS
64.3%
Concentration: share of company revenue
How much of each company’s total revenue sits in the segment above.
COF
74.2%
AXP
66.9%
WFC
44.5%
BAC
35.7%
JPM
34.9%
C
25.3%
USB
23.5%
GS
1.1%
Combined segment revenue
The 8 companies that report a segment for this product earned this in those segments in their latest quarters. It is the revenue of the whole reported segment, not of the product alone.
$75.12B
Coverage: Nasdaq 100 and S&P 100 companies mapped to Credit Cards (8 companies, 8 disclose a segment). Quarters differ by company; each row shows its own period end date.
Source: Revenue segments as reported in each company’s SEC filings. Products are mapped to segments from company pages.