Operations
As of September 16, 2026
Q4 Revenue
↑ 94% YoY
$462M
Divisions
Custom Products
63.1%
Powertrain Solutions
31.8%
Standard Products
2.4%
Services
2.7%
Key Earnings Driver
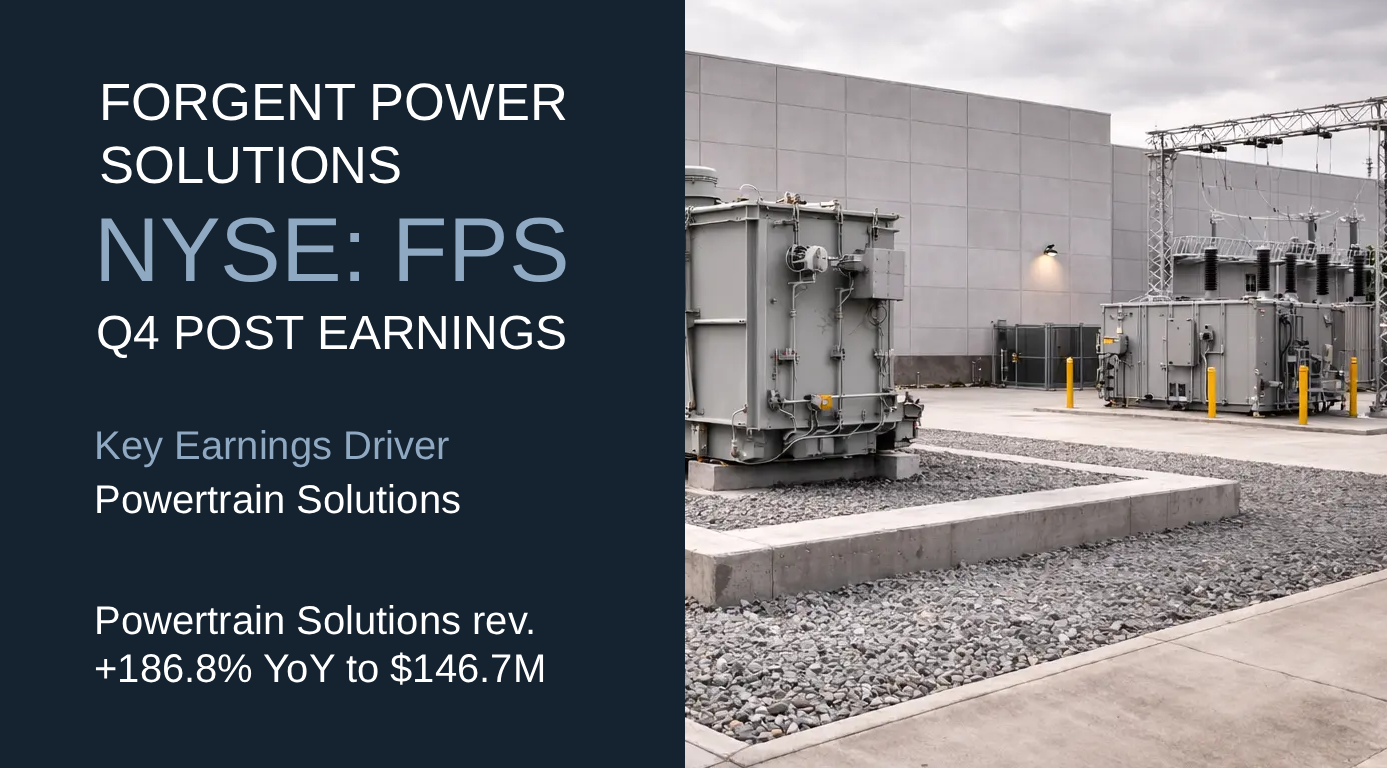
Powertrain Solutions Custom Products revenue increased 73.2% year over year to $291.5M, Powertrain Solutions revenue increased 186.8% to $146.7M, Standard Products revenue increased 11.2% to $11.2M, and Services increased 51.5% to $12.3M. Powertrain Solutions revenue grew 259% for fiscal 2026 and represented nearly one-third of Q4 revenue. Forgent is making an incremental investment in dedicated e-House and Powerskid production in Tijuana, to increase Powertrain Solutions capacity by more than 50%.
Key Operating Metrics¹
METRIC
STATUS
Custom Products↑ 73.2%
Powertrain Solutions↑ 186.8%
🟢 Scaling
Key Financial Metrics
Gross Margin
36.11%
+2.57 pp YoY
Backlog / Revenue
649.8%
6.49x Qtr Rev
CapEx Intensity
6.71%
0.06x Revenue
Key Operating Metrics¹: Core operating metrics relevant to revenue, sourced from website and/or SEC filings for Q, with status based on reported data.