
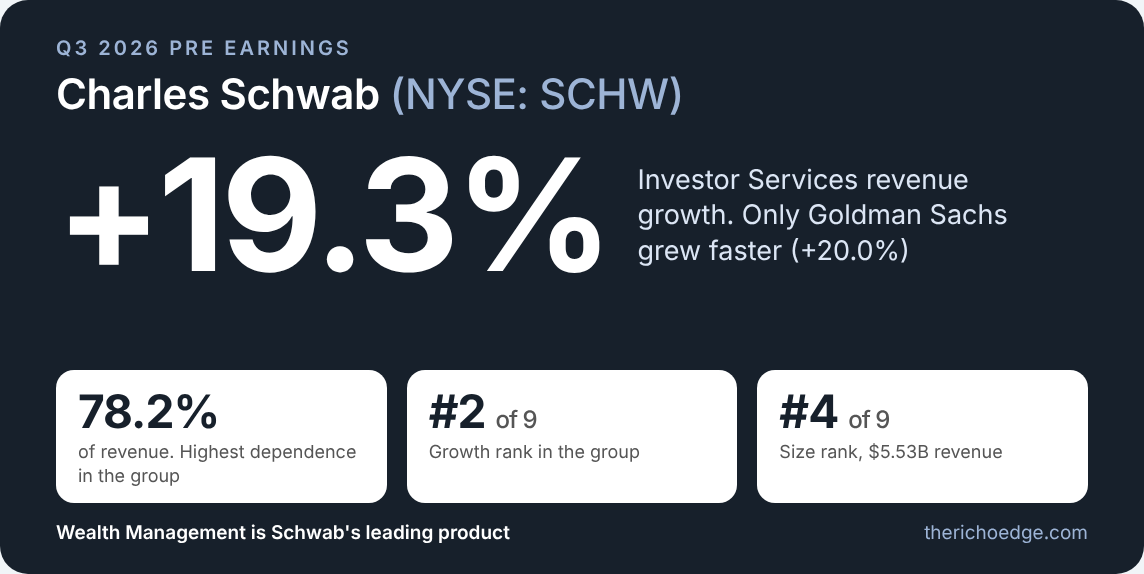
Its Investor Services segment, 78.2% of revenue, grew 19.3%, second only to Goldman Sachs’ Asset & Wealth Management (+20.0%) among the nine companies in the group, and Schwab depends on it more than any peer.
See every company in Wealth Management →Who else sells Wealth Management
The revenue segment each company reports that contains this product. 9 companies.
| Company | Quarter | Revenue segment | Segment revenue | % of company | Growth |
|---|---|---|---|---|---|
| JPM | Q2 FY2026 · Jun 30, 2026 | Consumer & Community Banking | $20.27B | 35.3% | ↑ 7.6% |
| JPM | Q2 FY2026 · Jun 30, 2026 | Asset & Wealth Management | $6.85B | 11.9% | ↑ 18.9% |
| MS | Q2 FY2026 · Jun 30, 2026 | Wealth Management | $8.86B | 41.5% | ↑ 14.1% |
| BAC | Q2 FY2026 · Jun 30, 2026 | Global Wealth & Investment Management | $6.87B | 21.8% | ↑ 15.7% |
| SCHW | Q2 FY2026 · Jun 30, 2026 | Investor Services | $5.53B | 78.2% | ↑ 19.3% |
| GS | Q2 FY2026 · Jun 30, 2026 | Asset & Wealth Management | $4.60B | 22.6% | ↑ 20.0% |
| WFC | Q2 FY2026 · Jun 30, 2026 | Wealth and Investment Management | $3.89B | 17.2% | ↑ 13.2% |
| USB | Q2 FY2026 · Jun 30, 2026 | Wealth, Corporate, Commercial and Institutional Banking | $3.77B | 49.1% | ↑ 17.1% |
| C | Q2 FY2026 · Jun 30, 2026 | Wealth | $3.18B | 12.8% | ↑ 12.9% |
| BNY | Q2 FY2026 · Jun 30, 2026 | Investment and Wealth Management | $863M | 15.1% | ↑ 7.7% |
Peer rank: year-on-year growth
Growth of the reported segment, latest quarter. A company with several segments shows its fastest.
Concentration: share of company revenue
How much of each company’s total revenue sits in the segment above.
Combined segment revenue
The 9 companies that report a segment for this product earned this in those segments in their latest quarters. It is the revenue of the whole reported segment, not of the product alone.
Coverage: Nasdaq 100 and S&P 100 companies mapped to Wealth Management (9 companies, 9 disclose a segment). Quarters differ by company; each row shows its own period end date.
Source: Revenue segments as reported in each company’s SEC filings. Products are mapped to segments from company pages.